Electricity Monthly Update
End Use: February 2024
Retail rates/prices and consumption
In this section, we look at what electricity costs and how much is purchased. Charges for retail electric service are based primarily on rates approved by state regulators. However, a number of states have allowed retail marketers to compete to serve customers and these competitive retail suppliers offer electricity at a market-based price.
EIA does not directly collect retail electricity rates or prices. However, using data collected on retail sales revenues and volumes, we calculate average retail revenues per kWh as a proxy for retail rates and prices. Retail sales volumes are presented as a proxy for end-use electricity consumption.
Average revenue per kWh by state
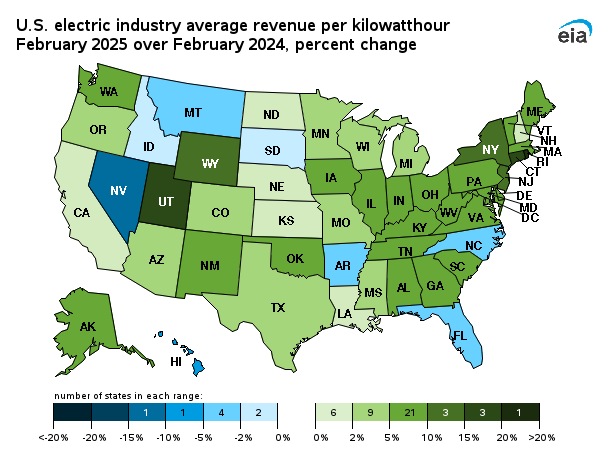
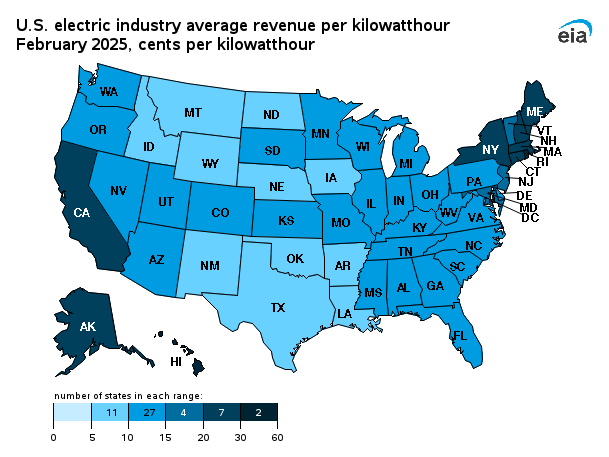
Twenty-three states and the District of Columbia saw increased revenue per kilowatt-hour (kWh) compared to last February, while average revenue per kWh increased by 0.4% on a national basis. The largest percent increase was in North Carolina, up 17.0%, followed by California, up 12.9%, and Oregon, up 11.4%. Compared to last year, average revenue per kWh figures decreased in twenty-seven states. The largest percent decrease was in New Hampshire, down 17.7%, followed by Louisiana, down 14.0%, and Indiana, down 12.3%. In the contiguous US, California, Rhode Island, and Connecticut had the highest average revenues at 25.37, 25.08, and 24.66 cents per kWh, respectively. Oregon had the median average revenue at 11.57 cents per kWh. North Dakota, Oklahoma, and Iowa had the lowest average revenues at 8.01, 8.26, and 8.54 cents per kWh, respectively.
| Average Revenues/Sales (¢/kWh) | Retail Sales (thousand MWh) | |||||||||||||||||||||||||||||||||||||||||||||||||||||||||||||||||||||||||||||||||||||||||||||||||
|---|---|---|---|---|---|---|---|---|---|---|---|---|---|---|---|---|---|---|---|---|---|---|---|---|---|---|---|---|---|---|---|---|---|---|---|---|---|---|---|---|---|---|---|---|---|---|---|---|---|---|---|---|---|---|---|---|---|---|---|---|---|---|---|---|---|---|---|---|---|---|---|---|---|---|---|---|---|---|---|---|---|---|---|---|---|---|---|---|---|---|---|---|---|---|---|---|---|---|
| End-use sector | February 2024 | Change fromFebruary 2023 | February 2024 | Change fromFebruary 2023 | Year to Date | |||||||||||||||||||||||||||||||||||||||||||||||||||||||||||||||||||||||||||||||||||||||||||||
| Residential | 16.10 | 0.8% | 117,716 | 4.6% | 260,555 | |||||||||||||||||||||||||||||||||||||||||||||||||||||||||||||||||||||||||||||||||||||||||||||
| Commercial | 12.81 | 0.9% | 106,394 | 4.9% | 221,237 | |||||||||||||||||||||||||||||||||||||||||||||||||||||||||||||||||||||||||||||||||||||||||||||
| Industrial | 7.81 | -3.6% | 77,915 | 2.4% | 160,639 | |||||||||||||||||||||||||||||||||||||||||||||||||||||||||||||||||||||||||||||||||||||||||||||
| Transportation | 13.20 | 1.6% | 518 | -5.8% | 1,123 | |||||||||||||||||||||||||||||||||||||||||||||||||||||||||||||||||||||||||||||||||||||||||||||
| Total | 12.80 | 0.3% | 302,543 | 4.1% | 643,553 | |||||||||||||||||||||||||||||||||||||||||||||||||||||||||||||||||||||||||||||||||||||||||||||
| Source: U.S. Energy Information Administration | ||||||||||||||||||||||||||||||||||||||||||||||||||||||||||||||||||||||||||||||||||||||||||||||||||
Total average revenues per kilowatt-hour (kWh) increased by 0.3% from last February, to 12.80 cents/kWh in February 2024. Three of the four sectors saw increases in average revenues per kWh. The Transportation sector saw the largest increase in average revenues per kWh from last February, up 1.6%, followed by the Commercial sector, up 0.9%, and the Residential sector, up 0.8%. The Industrial sector dropped the most from last February, down 3.6%. On a nationwide basis, retail sales increased by 4.1% in February 2024. Three of the four sectors saw increases in retail sales from last February. The Commercial sector increased the most from last February, up 4.9%, followed by the Residential sector, up 4.6%, and the Industrial sector, up 2.4%. Retail sales in the Transportation sector were down 5.8% from last February.
Retail sales
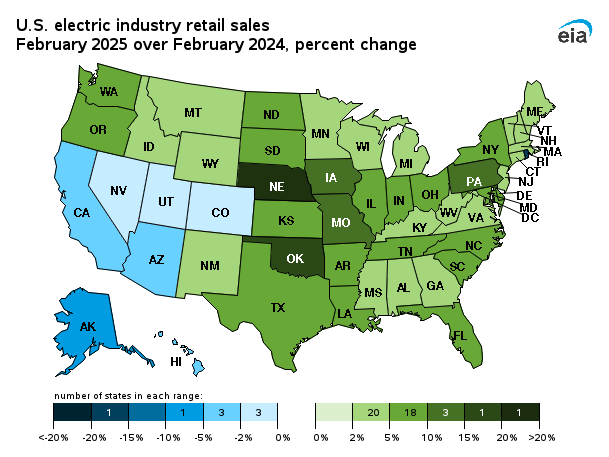
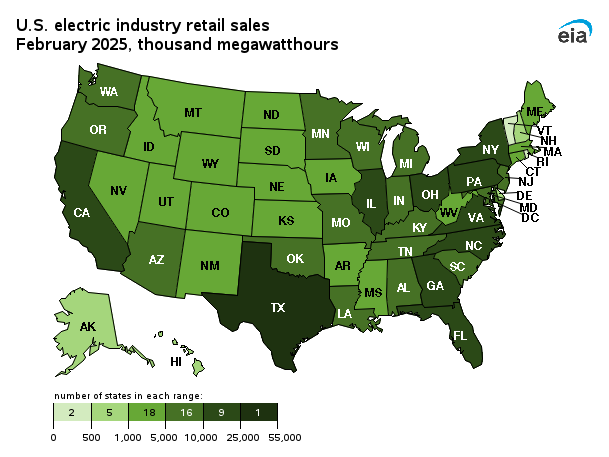
Forty-three states saw an increase in retail sales volume in February 2024 compared to February 2023. Pennsylvania had the highest percent year over year increase in retail sales, up 12.0%, followed by Viriginia, up 11.7%, and Alaska, up 11.0%. Seven states and the District of Columbia saw a decrease in retail sales volume compared to last year. Nebraska had the highest percent year over year decrease, down 4.2%, followed by Maine, down 4.1%, and Idaho, down 2.4%.
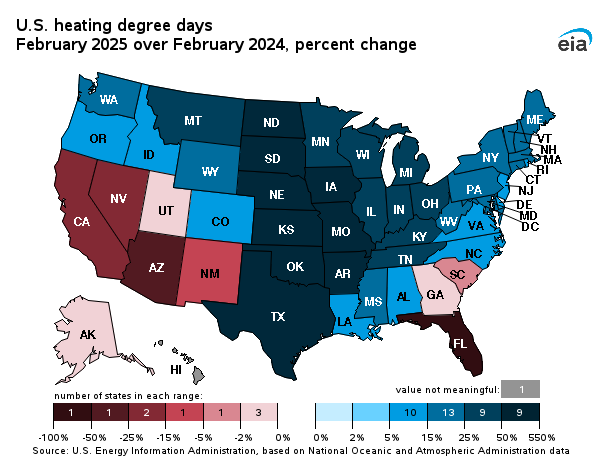
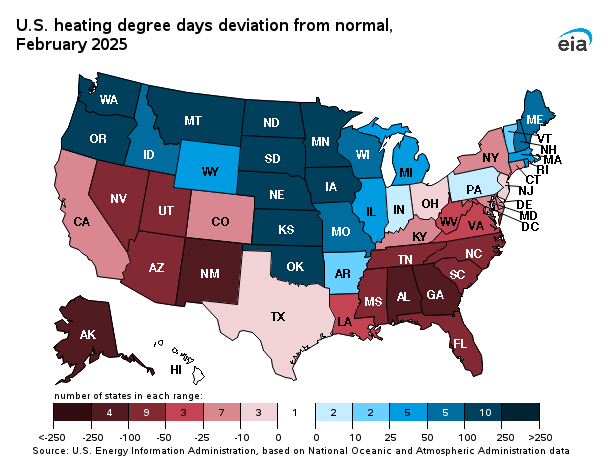
Nineteen states and the District of Columbia, saw an increase in HDDs compared to last February. In the contiguous US, Florida had the highest percent year over year increase, up 180%, followed by South Carolina, up 63%, and the District of Columbia, up 45%. Thirty states, saw a decrease in Heating Degree Days (HDDs) from last February. Nebraska had the highest percent year over year decrease, down 30%, followed by Oklahoma, down 29%, and Minnesota, down 28%. Most of the country, forty-four states, saw a warmer-than-normal February and thus a lower-than-normal amount of HDDs. Parts of the Southwest and the Pacific Coast saw a colder than normal February and thus an increase in HDDs.