
Early-release estimates from the 2010 MECS show that energy consumption in the manufacturing sector decreased between 2006 and 2010
MECS 2006-2010 — Release date: March 28, 2012
Energy consumption in the U.S. manufacturing sector fell from 21,098 trillion Btu (tBtu) in 2006 to 19,062 tBtu in 2010, a decline of almost 10 percent, based on preliminary estimates released from the 2010 Manufacturing Energy Consumption Survey (MECS). This decline continues the downward trend in manufacturing energy use since the 1998 MECS report.
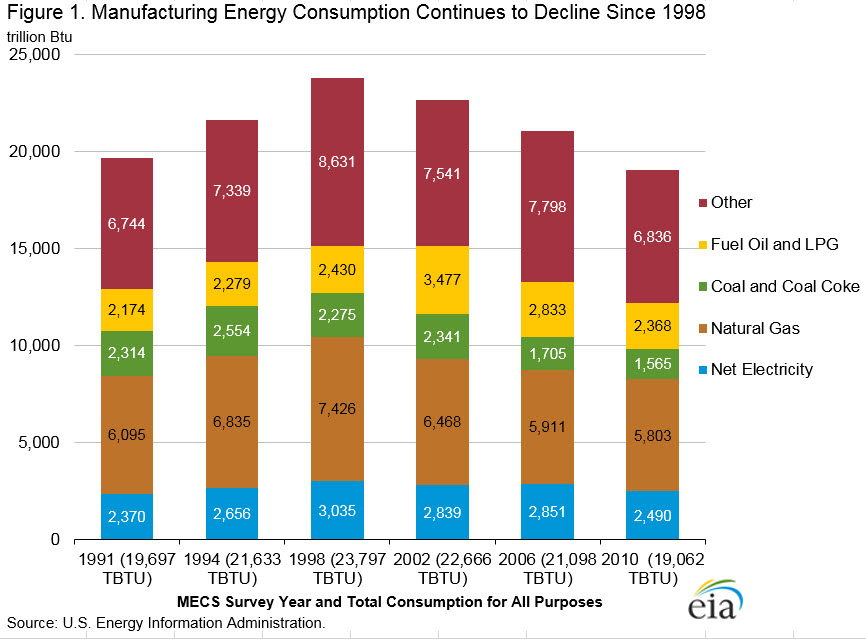
The decrease in energy consumption in the manufacturing sector was also evident for most individual energy sources (Table 1 and Figure 1). Only the biomass component of the “Other” category, which includes energy sources such as agricultural waste and wood chips increased slightly, though the increase is not statistically significant.
Preliminary estimates are now available from the 2010 MECS survey that show U.S. manufacturing consumption of energy for all purposes (Table 1). Consumption for all purposes is the measure that considers both fuel and nonfuel use together. It ensures that the energy content of the substance is counted only once by measuring it when it is first used by an establishment. EIA will release more detail in the fall, including estimates for specific manufacturing industries, size categories, and broad geographic regions.
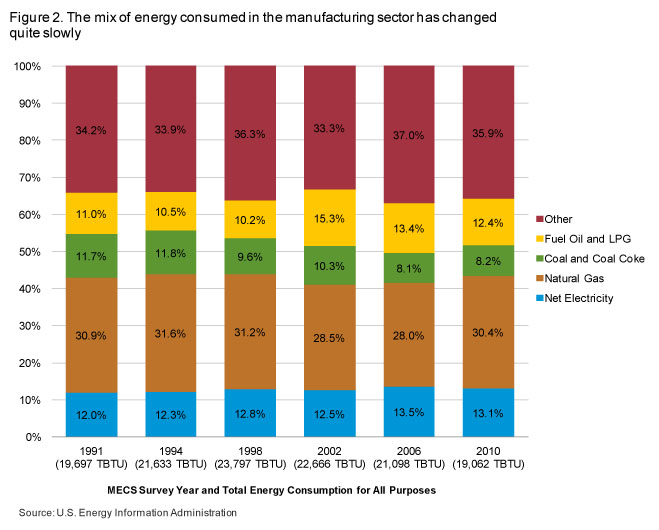
The relative shares of major categories of energy sources have changed only slightly since the 1991 MECS survey (Figure 2). However, some of these categorizations mask more specific changes that have occurred, for example, the decline of residual fuel oil as a process heating and boiler fuel and the increase of liquefied petroleum gases (LPG) as a raw material in the chemical industries. Coal used to make coke has also declined, which is commensurate with the decline in the use of the iron ore blast furnace in an integrated steel mill relative to the increased share of steel production from electric arc furnaces.
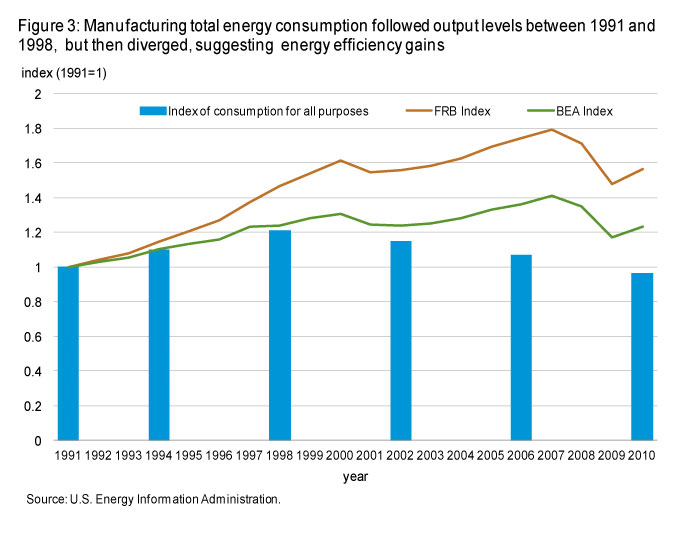
The overall decrease in manufacturing energy consumption from 2006 to 2010 mirrors the slowdown in manufacturing production during the same period, as measured by two different annual manufacturing output indexes. One is from the Federal Reserve Board (FRB)1, which is based on physical measures of production and the other from the Bureau of Economic Analysis (BEA)2, which is based on the monetary value of shipments collected from the Census Bureau (See Figure 3). However, manufacturing energy consumption and output indexes do not always move in the same direction: there are times when these two variables have moved in different directions, as was the case between 2002 and 2006. In fact, between 2002 and 2006, there was a 14 percent decrease in energy intensity, the ratio of a unit of energy consumption per unit of output. However, between 2006 and 2010, there was a net increase in energy intensity of 2 percent.
In general, manufacturing production strongly influences the level of energy consumption but so do changes in energy intensity. In turn, changes in overall manufacturing energy intensity are attributable to both changes in real energy efficiency, the amount of energy required to perform a service, and changes in the relative output levels of component industries. For example, as lower-intensity industries, such as computer chip manufacturing, grow at a faster rate than more energy-intensive manufacturing, such as steel making, the overall intensity of manufacturing will decrease even if no changes in energy intensity were observed in any of the individual industries. As more MECS detailed industry data are released in the fall, EIA will examine changes in energy efficiency more fully.
The 2010 early-release estimates are the first such data from the 2010 MECS. As survey data editing proceeds, it is possible that the estimates shown here will change.
Footnotes
1 Federal Reserve Board, Industrial Production and Capacity Utilization - G.17, http://www.federalreserve.gov/releases/G17/default.htm.
2 Bureau of Economic Analysis, Gross-Domestic-Product-(GDP)-by-Industry Data (Shipments), http://www.bea.gov/industry/xls/GDPbyInd_SHIP_NAICS_1998-2010.xls and http://www.bea.gov/industry/xls/GDPbyInd_SHIP_SIC.xls.