Figure 6. Coal consumption by sector, 2000-2010(million short tons) |
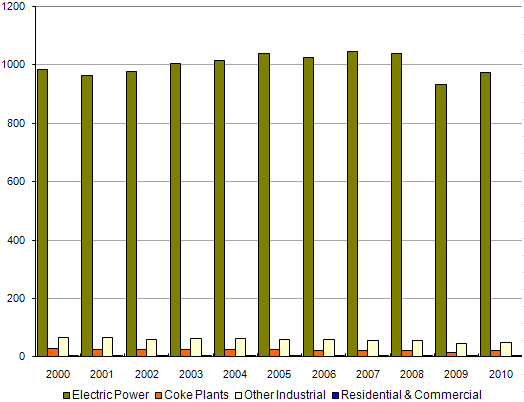 |
| Source: U.S. Energy Information Administration, Quarterly Coal Report, October-December, DOE/EIA-0121, various issues. |
Release Date: June 1, 2011 | Next Release Date: Periodically | full report
Figure 6. Coal consumption by sector, 2000-2010(million short tons) |
|
| Source: U.S. Energy Information Administration, Quarterly Coal Report, October-December, DOE/EIA-0121, various issues. |