Analysis of Impacts of a Clean Energy Standard as requested by Chairman Bingaman
Release date: November 30, 2011
Introduction
This report responds to a request from Senator Jeff Bingaman, Chairman of the U.S. Senate Committee on Energy and Natural Resources, for an analysis of a national Clean Energy Standard (CES). The request, as outlined in the letter included in Appendix A, sets out specific policy assumptions for the study.
Background
A CES is a policy that requires covered electricity retailers to supply a specified share of their electricity sales from qualifying clean energy resources. Under a CES, electric generators would be granted clean energy credits for every megawatthour (MWh) of electricity they produce using qualifying clean energy sources. Utilities that serve retail customers would use some combination of credits granted to their own generation or credits acquired in trade from other generators to meet their CES obligations. Generators without retail customers or utilities that generated more clean energy credits than needed to meet their own obligations could sell CES credits to other companies.
The design details of a CES can significantly affect its projected impacts. Chairman Bingaman's request sets out a base CES specification and several variants. The base CES specification, henceforth referred to as the Bingaman CES (BCES) case, has various provisions describing the definition of clean energy, the allocation of credits, and the dates when target milestones become binding, as described below:
- All generation from existing and new wind, solar, geothermal, biomass, municipal solid waste, and landfill gas plants earns full BCES credits.
- Incremental hydroelectric and nuclear generation from capacity uprates at existing plants and from new plants earns full BCES credits.
- Generation from existing nuclear and hydroelectric capacity does not receive any BCES credits. However, the total generation from these two sources counts towards the overall clean energy sales goal of the policy. Generation from these sources is reflected in the policy through a reduced requirement for holding BCES credits.
- Partial BCES credits are earned for generation using specific technologies fueled by natural gas or coal, based on a calculated crediting factor that reflects the carbon intensity of each technology relative to that of a new supercritical coal plant. These technologies include coal plants which capture and sequester their carbon dioxide emissions (0.9 BCES credits), natural gas plants that also sequester their carbon dioxide emissions (0.95 BCES credits), existing natural gas combined-cycle units (0.48 BCES credits), new gas combined-cycle units (0.59 BCES credits), existing gas combustion turbines (0.16 BCES credits), new gas combustion turbines (0.45 BCES credits), and integrated gasification combined-cycle (IGCC) coal plants without carbon capture (0.15 BCES credits).
- The BCES target for the share of retail electricity sales from clean energy sources starts at 45 percent in 2015 and ultimately reaches 95 percent in 2050. However, as noted above, the requirement to hold BCES credits is generally reduced by generation from existing nuclear and hydroelectric capacity, which counts toward the clean energy targets but does not earn BCES credits.
Table 1 below shows both the overall BCES case clean energy targets and the estimated requirement for covering sales with BCES credits given projected generation from existing nuclear and hydroelectric capacity. For example, in the Reference case1 projection for 2035, these generation sources account for about 24 percent of sales, so the 80-percent clean energy goal requires that 56 percent (80 percent minus 24 percent) of sales be covered by BCES credits. - BCES clean energy goals increase linearly between the milestones shown in Table 1, with a 2-percentage point annual increase between 2020 and 2035 and a 1-percentage point annual increase in the first 5 years of the BCES and between 2035 and 2050.
- There is no sunset date for the requirements, so the 95-percent clean energy goal remains in effect beyond 2050.
- All electricity providers are covered by the requirement, regardless of ownership type or size.
- BCES credits can be banked for use in a subsequent year. There is no limit on how many credits may be held or for how long they may be held.
- The BCES operates independently of any State-level policies. The same underlying generation can be used to simultaneously comply with the BCES and any State generation requirements, if otherwise allowed for by both Federal and State law.
| Table 1. BCES Clean Energy Goals and Credit Coverage Requirements | ||
| Year | Overall Clean-Energy Goal | Percentage of Total Sales that Must be Covered by BCES Credits |
|---|---|---|
| 2015 | 45% | 17% |
| 2020 | 50% | 23% |
| 2025 | 60% | 34% |
| 2030 | 70% | 45% |
| 2035 | 80% | 56% |
| 2040 | 85% | 63% |
| 2045 | 90% | 68% |
| 2050 | 95% | 74% |
Like other EIA analyses of energy and environmental policy proposals, this report focuses on the impacts of those proposals on energy choices in all sectors and the implications of those decisions for emissions and the economy. This focus is consistent with EIA's statutory mission and expertise. The study does not account for any possible health or environmental benefits that might be associated with the BCES policy.
Alternative Cases
As noted above, Chairman Bingaman also requested that several variations of the base CES specification be analyzed. The first three cases listed, the All Clean, Partial Credit, and Revised Baseline cases, examine several alternative treatments for existing nuclear and hydroelectric generation facilities, giving them either a partial or a full credit for generation. The Partial Credit case also includes an alternative treatment for the crediting of qualifying fossil generation.
All Clean case (AC): Generation from existing nuclear and hydroelectric capacity receives full credit. As indicated in Table 2, in this case, the requirement to hold BCES credits is equivalent to the overall clean energy goal.
Partial Credit case (PC): Generation from all natural gas combined-cycle units without carbon capture equipment receives one-half credit. Gas combustion turbines and coal plants without carbon capture do not receive credit. However, generation from existing nuclear and hydroelectric plants each receive one-tenth of a credit, which provides an added incentive to continue operating existing capacity of these types relative to the BCES case. As shown in Table 2, the requirements to hold BCES credits are adjusted from the BCES case to account for the differing crediting scheme and to maintain the overall goal forclean energy generation.
Revised Baseline case (RB): Electricity service providers may subtract generation from existing nuclear and hydroelectric capacity from their sales baseline when calculating their clean energy requirement. Although the requirement for covering sales with BCES credits shown in Table 2 differs slightly from the requirements in the BCES case, this case is meant to achieve the same overall goal for clean energy use. Removing generation from existing nuclear and hydroelectric facilities from the sales baseline and adjusting the target to compensate for this change provides an incentive to continue operating existing nuclear and hydroelectric facilities.
The next four cases potentially reduce the amount of clean energy stimulated by the CES, either by exempting small electricity suppliers from meeting the target (“Small Utilities Exempt”), capping the maximum credit price paid by suppliers (“Credit Cap 2.1” and “Credit Cap 3.0”), or decreasing total electricity demand through increased efficiency standards (“Standards and Codes”).
Small Utilities Exempt case (SUE): Electricity suppliers with annual sales lower than 4 million MWh are exempt from the clean energy requirements. They may produce and sell BCES credits, but they do not need to hold them. As with the Revised Baseline case, the effective sales basis is reduced in this case relative to the BCES case; however, unlike the BCES case, there is no adjustment to the mandatory target applied to each affected utility. As shown in Table 2, the clean energy target as a percent of covered sales in the SUE case is the same as in the BCES case. However, as a percent of total sales, the CES in the SUE case is less stringent than in the BCES case.
Credit Cap 2.1 case (C2.1): The price of BCES credits is effectively capped through the availability of unlimited alternative compliance credits starting at a price of 2.1 cents per kilowatthour in 2015 and rising 5 percent per year above the rate of inflation each year thereafter. Although neither the goal nor the mandatory targets is changed in this case from the BCES case, the amount of clean energy generation achieved may be less than the indicated goal/target to the extent that alternative compliance credits are used for compliance in lieu of credits from actual clean energy generation.
Credit Cap 3.0 case (C3.0): Unlimited alternative compliance credits are made available starting at a price of 3.0 cents per kilowatthour in 2015 and rising 5 percent per year above the rate of inflation each year thereafter. Although neither the goal nor the mandatory targets are changed in this case from the BCES case, the amount of clean energy generation achieved may be less than the indicated goal/target to the extent that alternative compliance credits are used for compliance in lieu of credits from actual clean energy generation.
Standards and Codes case (S+C): Adds additional rounds of efficiency standards for currently covered products as well as new standards for products not yet covered. Efficiency levels assume improvement similar to those in Energy Star or Federal Energy Management Plan (FEMP) guidelines. The Standards and Codes case corresponds to the Expanded Standards and Codes case that was part of AEO2011. More information about the assumptions underlying this case can be found in Appendix E of the AEO2011.
With the exception of the SUE case, all of the alternative cases described above share the goal in the BCES case of covering 80 percent of total national sales with generation from clean energy by 2035. However, the number of credits required in each case varies because of differences in the sales baselines and the number of credits assigned to different technologies, particularly with respect to the treatment of generation from existing hydroelectric facilities and nuclear plants (Table 2). In the BCES, AC and PC cases all sales are covered by the credit program. In the RB case, covered sales are reduced by the generation from existing hydroelectric and nuclear plants and, in the SUE case, they are reduced by sales from small utilities.
Focusing on 2035, in the BCES case 56 percent of total sales must be covered by credits. As described above, the credit share required in the BCES case is below the 80 percent clean energy goal because projected generation coming from existing hydroelectric and nuclear plants does not earn credits but still counts towards the overall clean energy goal. In the AC case, the share of sales that must be covered by credits equals the overall clean energy goal because all generation from hydroelectric and nuclear plants, whether existing or new, earn credits. In the PC and RB cases, the share of total sales that must be covered by credits is very similar to that in the BCES case. The shares are slightly higher in the PC case because generation from existing hydroelectric and nuclear plants earns a small share of credits in this case. In the SUE case, the share of total sales that must hold credits is significantly lower than in the BCES case because sales from small utilities are not required to hold credits. These small utilities account for roughly 25 percent of sales so the overall credit share required is lower by about that amount.
| Table 2. Clean Energy Goals and Credit Shares Across Select Cases1 | |||||||
|---|---|---|---|---|---|---|---|
| Year | Overall Clean-Energy Goal1 | BCES | AC | PC | RB | SUE | SUE as a Percent of Covered by BCES Credits |
| 2015 | 45% | 17% | 45% | 20% | 23% | 12% | 17% |
| 2020 | 50% | 23% | 50% | 26% | 32% | 17% | 23% |
| 2025 | 60% | 34% | 60% | 37% | 46% | 25% | 34% |
| 2030 | 70% | 45% | 70% | 48% | 60% | 34% | 45% |
| 2035 | 80% | 56% | 80% | 58% | 74% | 42% | 56% |
| 2040 | 85% | 62% | 85% | 64% | 80% | 46% | 62% |
| 2045 | 90% | 68% | 90% | 70% | 87% | 50% | 68% |
| 2050 | 95% | 74% | 95% | 76% | 94% | 54% | 74% |
| 1 Goal is expressed as a percent of all sales, except for the Small Utilities Exempt (SUE) case, where it is expressed as a percent of covered sales, as specified in the modified request letter for this study (see Appendix A). In 2035, covered sales in the SUE case are about 75 percent of national sales, reducing the effective clean energy goal to about 60 percent of national sales. For the C2.1 and C3.0 cases, the realized clean energy coal may fall below the 80 percent national target due to the use of alternative compliance credits. | |||||||
Results
BCES case impacts relative to the AEO2011 Reference case
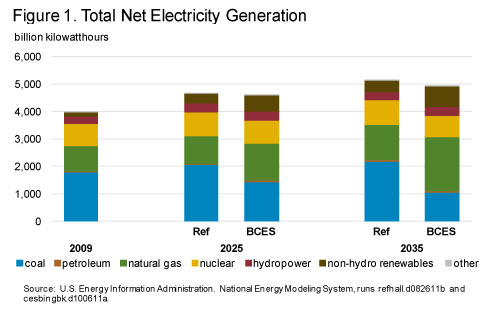
The BCES policy changes the generation mix, reducing the role of coal technologies and increasing reliance on natural gas, non-hydro renewable and nuclear technologies (Figure 1, Tables B1 and B2). Coal-fired generation, which in the Reference case increases by 23 percent from 2009 to 2035, decreases by 41 percent in the BCES case over the same period. Relative to the Reference case, where natural gas generation grows steadily throughout the projection period, natural gas generation in 2025 is 34-percent higher and 53-percent higher in 2035. Under the BCES policy, non-hydro renewable technologies grow at the fastest rate, increasing from 146 billion kilowatthours in 2009 to 601 billion kilowatthours in 2025 and 737 billion kilowatthours in 2035. These totals are 60 percent and 75 percent greater than the 2025 and 2035 Reference case projections, respectively.
The BCES case provides different incentives to existing and new nuclear power plants because only the latter earn credits. Nearly 65 gigawatts of new capacity are installed by 2035 in the BCES case compared to approximately 6 gigawatts in the Reference case. Generation from existing nuclear plants does not qualify for credits and, as a result, more than 14 gigawatts of this capacity are taken out of service, while less than 2 gigawatts of capacity are retired in the Reference case.
Since fossil-fueled generation that captures and sequesters carbon emissions is given nearly full BCES credit, the BCES spurs 47 gigawatts of coal capacity to be retrofitted with carbon capture and sequestration (CCS) equipment by 2035. Nearly all of these retrofits occur in the final 10 years of the forecast period, with less than one gigawatt of capacity retrofitted by 2025. No new coal plants with CCS are added in the BCES case beyond the small amount found in the Reference case.
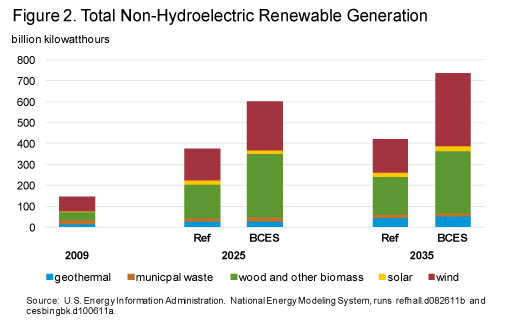
Among renewable sources, wind and biomass have the largest generation increases under the BCES (Figure 2, Tables B1 and B2). Under the BCES policy, 2035 wind generation is more than five times its 2009 level. Total 2035 wind generation under the BCES is more than double the 2035 level in the Reference case. Biomass generation shows robust growth, as well, within the BCES framework. All of the growth in biomass use relative to the Reference case is attributable to co-fired generation, which reaches 187 billion kilowatthours in 2025 before declining to 156 billion kilowatthours in 2035 as coal-fired plants that co-fire biomass are retired.
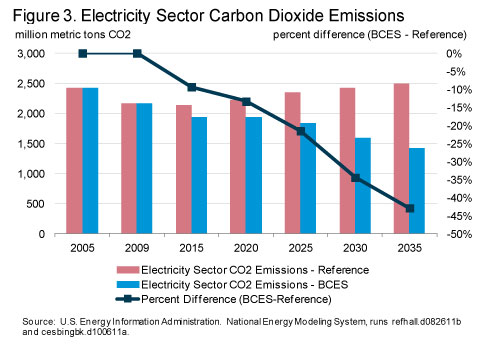
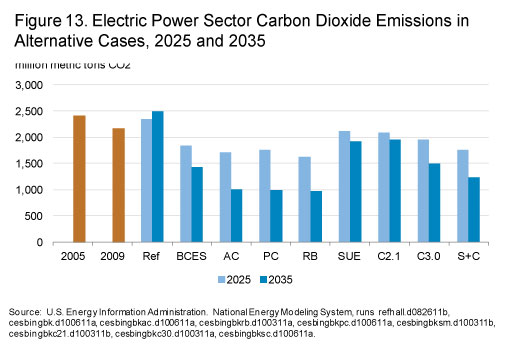
Under the BCES, projected annual electricity sector carbon dioxide emissions are 22 percent below the Reference case level in 2025 and 43 percent lower in 2035 (Figure 3, Tables B1 and B2). In the Reference case electricity-sector carbon dioxide emissions increase modestly over the projection period, reaching annual emissions of 2,345 million metric tons of carbon dioxide (MMTCO2) in 2025 and growing further to 2,500 MMTCO2 emitted in 2035. Over the 2009-to-2035 period, cumulative CO2 emissions are 20 percent lower in the BCES case than they are in the Reference case.
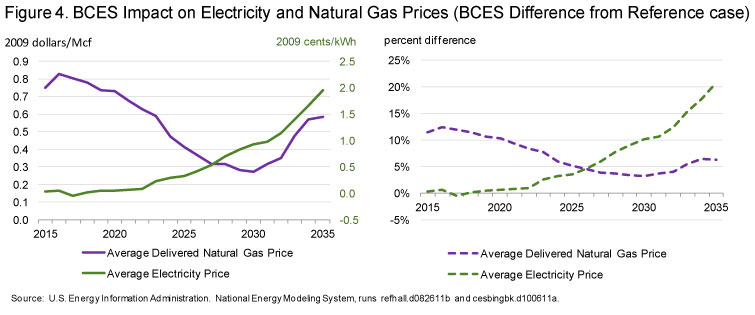
The BCES has a negligible impact on electricity prices through 2022, but prices rise in later years. (Figure 4, Tables B1 and B2). In the early years of the projection period, there is negligible impact on average end-use electricity prices, as the requirement to hold BCES credits is modest. As shown in Table 1, the share of total sales that must be covered by credits does not exceed 45 percent until after 2030. This is important because, while coal-fired plants do not receive BCES credits, efficient combined cycle plants receive 0.48 credits for each megawatthour they generate, more than retailers purchasing their output are required to hold until after 2030. This effectively reduces the cost of most natural gas-fired generation until the later years of the projections. Electricity prices do grow later in the projections, reaching 21 percent above the Reference case level by 2035 in the BCES case.
While average end-use electricity prices increase nationally after 2020 in the BCES case, the increase is not the same across all regions (Table 3). In 2025, when national average electricity prices in the BCES case are projected to be 3.6 percent above the Reference case level, regional projected prices are below the Reference case level in 8 of the 22 regions including New England (NEWE) and California (CAMX) which already have significant generation from eligible clean energy resources. By 2035, prices are below the Reference case level in only one region, MRO East (MROE), reflecting the significant share of qualified end-use generation projected to be co-produced in that region by facilities producing cellulosic biofuels to comply with the Federal Renewable Fuels Standard. The regions with the highest price increases in 2035 (by percent) are the SERC Central Region (SRCE) (69.2-percent increase) and the WECC Northwest Region (NWPP) (61.5-percent increase). The two regions with the highest increases in terms of cents per kilowatthour in 2035 are NPCC Long Island (NYLI), where prices increase by 5.2 cents/kWh and SERC Central (SRCE), where prices increase by 4.2 cents/kWh.
| Table 3. BCES Regional End-use Sector Average Prices (2009 cents/kWh) | ||||||
| Region | 2009 | 2025 | 2035 | |||
|---|---|---|---|---|---|---|
| Reference | BCES | Reference | BCES | |||
| ERCT - ERCOT All | 10.4 | 9.2 | 9.0 | 10.0 | 11.6 | |
| FRCC - FRCC All | 11.6 | 10.9 | 12.0 | 11.2 | 13.6 | |
| MROE - MRO East | 9.3 | 7.5 | 7.0 | 7.3 | 5.9 | |
| MROW - MRO West | 7.6 | 6.8 | 8.0 | 6.9 | 8.9 | |
| NEWE - NPCC New England | 15.7 | 13.6 | 12.2 | 13.1 | 14.3 | |
| NYCW - NPCC NYC/Westchester | 19.9 | 16.8 | 16.7 | 16.9 | 19.6 | |
| NYLI - NPCC Long Island | 18.1 | 16.7 | 17.4 | 16.6 | 21.8 | |
| NYUP - NPCC Upstate NY | 11.6 | 11.9 | 11.1 | 12.6 | 14.4 | |
| RFCE - RFC East | 12.2 | 10.7 | 11.7 | 10.9 | 12.4 | |
| RFCM - RFC Michigan | 9.6 | 8.7 | 9.0 | 9.0 | 11.4 | |
| RFCW - RFC West | 8.6 | 8.5 | 8.5 | 9.9 | 11.0 | |
| SRDA - SERC Delta | 7.5 | 7.3 | 7.2 | 7.5 | 9.7 | |
| SRGW - SERC Gateway | 7.8 | 6.5 | 6.7 | 7.0 | 9.6 | |
| SRSE - SERC Southeastern | 9.1 | 8.7 | 8.9 | 8.5 | 10.3 | |
| SRCE - SERC Central | 7.8 | 6.0 | 7.2 | 6.0 | 10.2 | |
| SRVC - SERC VACAR | 8.6 | 8.1 | 9.1 | 8.3 | 11.2 | |
| SPNO - SPP North | 7.9 | 7.6 | 8.9 | 7.5 | 8.9 | |
| SPSO - SPP South | 6.9 | 7.8 | 8.0 | 8.5 | 10.4 | |
| AZNM - WECC Southwest | 9.8 | 9.5 | 9.5 | 10.4 | 11.3 | |
| CAMX - WECC California | 13.3 | 14.6 | 13.1 | 13.2 | 14.0 | |
| NWPP - WECC Northwest | 7.0 | 4.6 | 6.4 | 5.2 | 8.4 | |
| RMPA - WECC Rockies | 8.2 | 9.0 | 9.4 | 9.4 | 11.1 | |
| U.S. Average | 9.8 | 9.0 | 9.4 | 9.4 | 11.3 | |
| BCES electricity price is 10-25 percent greater than the Reference case electricity price |
||||||
| BCES electricity price is 25 percent or more greater than the Reference case electricity price | ||||||
| Source: U.S. Energy Information Administration. National Energy Modeling System, runs refhall.d082611b and cesbingbk.d100611a. Note: See Appendix C for a map of the NEMS electricity market module regions. |
||||||
Natural gas prices also increase in the BCES case, particularly in the early years of the projections (Figure 4, Tables B1 and B2). Early in the projection, natural gas prices rise as generation from natural gas increases to comply with the BCES and bank credits for future use. As new capacity is built and other clean technologies continue to be expanded, the natural gas price premium over the Reference case gradually declines. Natural gas price impacts reach their height in 2016, where prices are $0.83/ thousand cubic feet (12 percent) higher than in the Reference case.
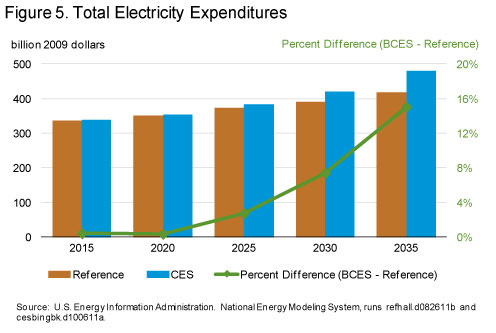
 Electricity expenditures increase in the BCES case after 2020 as a result of higher electricity prices (Figure 5, Tables B1 and B2). However, because electricity sales decrease later in the forecast period relative to the Reference case, the impact on electricity expenditures is smaller than the impact on electricity prices. In 2025 and 2035, total annual electricity expenditures across all sectors in the BCES case are 2.8 percent and 15.1 percent above the projected Reference case level, respectively. Household average annual electricity expenditures similarly increase over the projection horizon. In 2025, average household electricity expenditures are $1,198 in the BCES case – $36 above the Reference case. This difference increases to $170 in 2035 between the two cases ($1,366 versus $1,196).
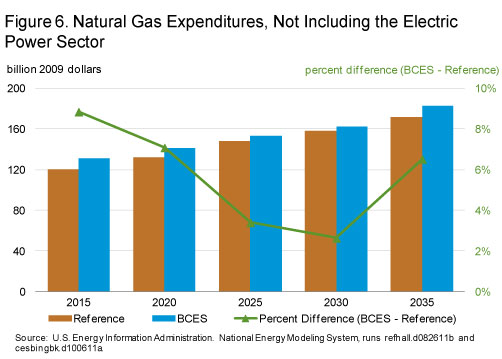
 Higher natural gas prices also lead to increased natural gas expenditures outside the electricity sector in the BCES case (Figure 6, Tables B1 and B2). In 2025, non-electric natural gas expenditures in the BCES case are 3.4 percent higher than Reference case levels. This differential increases to 6.5 percent by 2035. Natural gas expenditures in the electric power sector experience upward pressure from both higher prices and higher consumption, but the impact of those changes on ultimate consumers is reflected in their electricity expenditures.
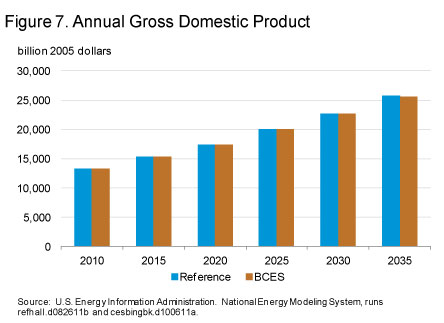
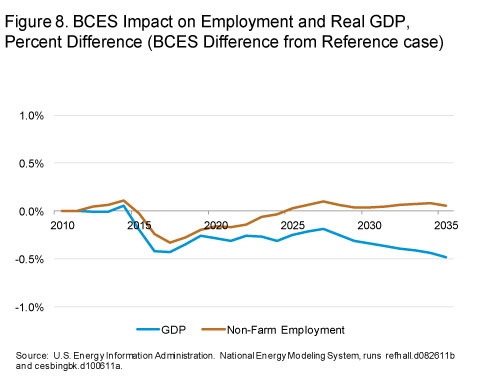
 The BCES case reduces projected real Gross Domestic Product (GDP) relative to the Reference case, with a peak difference in the GDP level of less than half of one percent in 2035 and generally lower impact in earlier years. (Figures 7 and 8, Tables B1 and B2). GDP grows at an average annual rate of 2.67 percent between 2009 and 2035 in the BCES case, just slightly below the Reference case growth rate of 2.69 percent.
Alternative Case Results
As described earlier, EIA also prepared alternative cases that vary certain aspects of the CES policy. This section briefly describes the main impacts of these alternative cases.
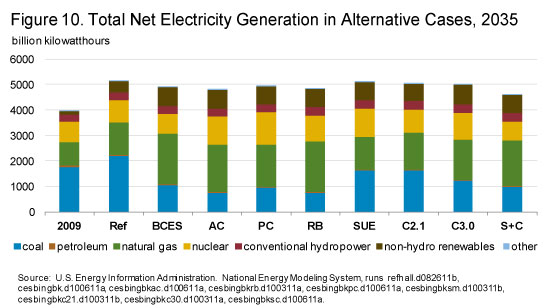
 As in the BCES case, each of the alternative cases shows reductions in coal generation and increases in natural gas, renewable and nuclear generation (Figures 9 and 10). Because each of the alternative cases maintains the basic structure of giving renewable generation a full credit and no credits to conventional coal generation, all of the cases show renewable electricity generation growth relative to the Reference case. Natural gas and nuclear generation levels vary across the cases. The All Clean (AC), Partial Credit (PC) and Revised Baseline (RB) cases all show greater nuclear generation than in the BCES case.Each of these cases contains provisions aimed at providing some credit to existing nuclear plants which results in greater nuclear generation and lower coal generation. The highest nuclear generation occurs in the PC case where it reaches levels 9.7 percent and 62.2 percent greater than the BCES case in 2025 and 2035, respectively. This generation is 8.2 percent and 46.3 percent above the Reference case levels in those same years.
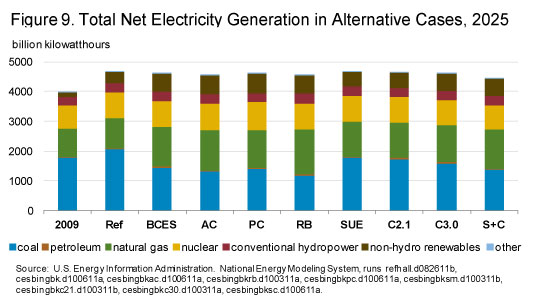 The shift away from coal is smaller in the cases with credit price caps, as compliance is achieved by making alternative compliance payments. This is particularly true in the Credit Cap 2.1 (C2.1) case where renewable generation is the smallest among alternative cases. Both this case and the Small Utilities Exempt (SUE) case, where suppliers with sales of less than four million MWhs are exempt from meeting the targets, have the largest coal generation as a result of the ability to comply without needing as much clean generation. The role played by fossil-fueled technologies that sequester carbon emissions varies across the cases, with larger amounts seen in the AC and RB cases that tend to have higher CES credit prices that spur the use of higher-cost technologies.
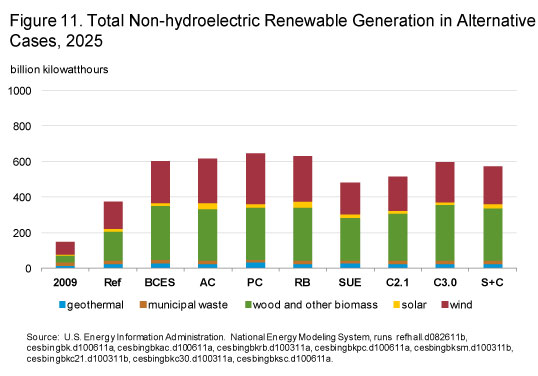
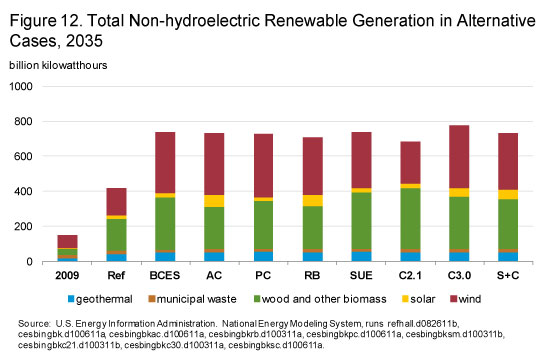
 Non-hydroelectric renewable generation increases relative to the Reference case in all of the alternative cases, but it varies among them (Figures 11 and 12). The lowest level among the alternative cases in 2035 occurs in the C2.1 case where utilities rely on making alternative compliance payments rather than increasing clean generation, while the highest level occurs in the C3.0 case. In the C3.0 case, the option to make alternative compliance payments at a higher rate than in the C2.1 case results in coal generation between the levels in the BCES and C2.1 cases. However, the credit price levels in the C3.0 case are not high enough to support the high levels of new nuclear capacity seen in the other alternative cases, leading to a slightly higher level of non-hydro renewable generation than occurs in those cases.
 While all alternative cases achieve carbon dioxide emissions reductions in the electric power sector relative to the Reference case, there are significant differences across cases (Figure 13). Trends in emissions directly reflect the generation mix. The cases with the largest emissions reductions, the RB, PC, and AC cases, achieve between 25 percent to 31 percent lower emissions in 2025 than in the Reference case. By 2035, their electricity sector carbon dioxide emissions fall to levels 60 percent to 63 percent below the Reference case, much larger than the 43 percent reduction seen in the BCES case. The larger emissions reductions in these cases occur because of incentives in them to continue operating existing nuclear plants while retiring additional coal plants. The opposite occurs in the SUE, C3.0, and C2.1 cases where the exclusion of small utilities from coverage or the credit price cap reduce the amount of clean energy needed for compliance.
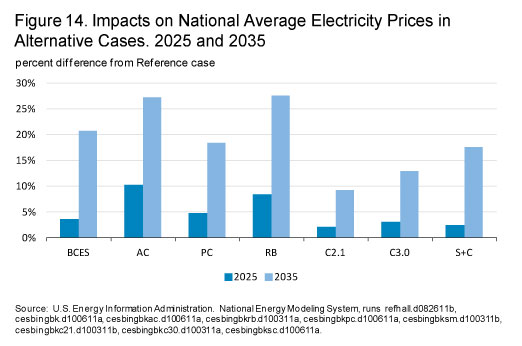
 Each of the alternative cases causes average end-use electricity prices to rise relative to the Reference case by 2035, but there is a wide range of price changes (Figure 14). As in the BCES case, 2025 electricity price increases among the alternative cases are modest. The only case where 2025 electricity prices exceed Reference case prices by more than 10 percent is the AC case, where they are 10.3 percent higher. This occurs because the required credit share is much higher in the AC case, exceeding the credits given to natural gas combined cycle plants by 2018, much earlier than in the other cases. In contrast, the only case shown in Figure 14 to have a 2035 average electricity price that is not at least 10 percent above the Reference case projected price is the Credit Cap 2.1 case. Average 2035 electricity prices among all cases, however, are less than 30 percent higher than Reference case prices in that same year. The two cases with the highest percentage increases in 2035 prices are the Revised Baseline case and the All Clean case, each having prices that are approximately 27 percent higher than the Reference case. The electricity price in the Standards and Codes case does not reflect the higher level of expenditures needed for structures and equipment to meet more stringent codes and standards.
 Electricity prices from the SUE case are not displayed in Figure 14, because EIA is not able to disaggregate the price impacts of exempt small utilities from those of larger covered utilities. Average price impacts in this case are subject to misinterpretation given that there is likely to be a considerable divergence in the price impacts on customers of exempt and non-exempt electricity providers. Price impacts in this case will vary depending on how the value of the credits earned by clean energy generators serving uncovered small utilities flows through to electricity prices. If the credits from these generators generally flow with the electricity to the small utilities they serve, the electricity prices to the customers of the exempt providers could actually fall because of revenue they earn selling the credits to non-exempt providers. However, the degree to which this might occur is uncertain.
 Regional electricity prices also vary widely across cases (Tables 4 and 5). As with the national prices, the magnitude of the regional price impacts compared to the Reference case depends on the overall stringency of the targets and whether or not the compliance costs are capped. Generally, the largest price increases in percentage terms occur in regions where Reference case prices are relatively low (e.g. NWPP) or where prices are below the national average in regions that are heavily dependent on coal. As in the BCES case, prices in the MROE region decrease across all alternative cases by 2035. The All Clean and Standards and Codes cases cause the greatest number of regions (15 out of 22) to experience price increases of more than 25 percent in 2035. However, as noted in the discussion of the BCES case results, electricity expenditure impacts in the Standards and Codes case are ameliorated by lower levels of electricity use.
| Table 4. Regional Average Electricity Prices in Alternative Cases, 2025 (2009 cents/kWh) | |||||||||
| Region | 2009 | 2025 | |||||||
|---|---|---|---|---|---|---|---|---|---|
| Ref | BCES | AC | PC | RB | C2.1 | C3.0 | S+C | ||
| ERCT - ERCOT All | 10.4 | 9.2 | 9.0 | 10.9 | 9.1 | 9.6 | 9.0 | 8.9 | 10.9 |
| FRCC - FRCC All | 11.6 | 10.9 | 12.0 | 12.7 | 12.0 | 12.1 | 11.3 | 11.4 | 12.7 |
| MROE - MRO East | 9.3 | 7.5 | 7.0 | 7.7 | 6.9 | 7.3 | 7.2 | 7.0 | 7.7 |
| MROW - MRO West | 7.6 | 6.8 | 8.0 | 7.9 | 8.1 | 8.0 | 7.4 | 7.4 | 7.9 |
| NEWE - NPCC New England | 15.7 | 13.6 | 12.2 | 14.6 | 12.5 | 13.7 | 13.3 | 12.8 | 14.6 |
| NYCW - NPCC NYC/Westchester | 19.9 | 16.8 | 16.7 | 18.2 | 16.7 | 17.4 | 16.7 | 16.3 | 18.2 |
| NYLI - NPCC Long Island | 18.1 | 16.7 | 17.4 | 19.6 | 17.4 | 18.6 | 17.2 | 17.3 | 19.6 |
| NYUP - NPCC Upstate NY | 11.6 | 11.9 | 11.1 | 13.2 | 11.2 | 12.2 | 11.8 | 11.5 | 13.2 |
| RFCE - RFC East | 12.2 | 10.7 | 11.7 | 12.7 | 10.8 | 11.5 | 10.6 | 12.0 | 12.7 |
| RFCM - RFC Michigan | 9.6 | 8.7 | 9.0 | 9.9 | 9.1 | 9.3 | 9.1 | 8.9 | 9.9 |
| RFCW - RFC West | 8.6 | 8.5 | 8.5 | 10.1 | 9.5 | 9.7 | 8.9 | 8.9 | 10.1 |
| SRDA - SERC Delta | 7.5 | 7.3 | 7.2 | 6.5 | 7.0 | 7.1 | 7.2 | 7.2 | 6.5 |
| SRGW - SERC Gateway | 7.8 | 6.5 | 6.7 | 8.3 | 6.8 | 7.5 | 6.5 | 6.6 | 8.3 |
| SRSE - SERC Southeastern | 9.1 | 8.7 | 8.9 | 9.0 | 8.9 | 8.9 | 8.9 | 8.9 | 9.0 |
| SRCE - SERC Central | 7.8 | 6.0 | 7.2 | 6.7 | 7.3 | 7.1 | 6.8 | 7.1 | 6.7 |
| SRVC - SERC VACAR | 8.6 | 8.1 | 9.1 | 8.5 | 9.2 | 8.9 | 8.7 | 8.8 | 8.5 |
| SPNO - SPP North | 7.9 | 7.6 | 8.9 | 9.1 | 8.6 | 9.0 | 7.8 | 8.4 | 9.1 |
| SPSO - SPP South | 6.9 | 7.8 | 8.0 | 9.1 | 8.0 | 8.5 | 8.1 | 8.0 | 9.1 |
| AZNM - WECC Southwest | 9.8 | 9.5 | 9.5 | 9.8 | 10.0 | 9.8 | 9.7 | 9.6 | 9.8 |
| CAMX - WECC California | 13.3 | 14.6 | 13.1 | 13.2 | 13.1 | 13.2 | 13.2 | 13.1 | 13.2 |
| NWPP - WECC Northwest | 7.0 | 4.6 | 6.4 | 4.7 | 6.0 | 5.5 | 5.6 | 5.8 | 4.7 |
| RMPA - WECC Rockies | 8.2 | 9.0 | 9.4 | 11.0 | 9.9 | 10.2 | 9.2 | 9.3 | 11.0 |
| U.S. Average | 9.8 | 9.0 | 9.4 | 9.4 | 9.5 | 9.7 | 9.2 | 9.3 | 9.4 |
| BCES/alternative case electricity price is 10-25 percent greater than the Reference case electricity price |
|||||||||
| BCES/alternative case electricity price is more than 25 percent above the Reference case electricity price | |||||||||
| Source: U.S. Energy Information Administration. National Energy Modeling System, runs refhall.d082611b, cesbingbk.d100611a, cesbingbkac.d100611a, cesbingbkrb.d100311a, cesbingbkpc.d100611a, cesbingbkc21.d100311b, cesbingbkc30.d100311a, cesbingbksc.d100611a. | |||||||||
| Table 5. Regional Average Electricity Prices in alternative Cases, 2035 (2009 cents/kWh) | |||||||||
| Region | 2009 | 2035 | |||||||
|---|---|---|---|---|---|---|---|---|---|
| Ref | BCES | AC | PC | RB | C2.1 | C3.0 | S+C | ||
| ERCT - ERCOT All | 10.4 | 10.0 | 11.6 | 14.2 | 11.5 | 13.0 | 10.4 | 10.8 | 14.2 |
| FRCC - FRCC All | 11.6 | 11.2 | 13.6 | 14.6 | 13.5 | 14.3 | 12.7 | 13.0 | 14.6 |
| MROE - MRO East | 9.3 | 7.3 | 5.9 | 4.1 | 6.2 | 4.7 | 6.5 | 6.3 | 4.1 |
| MROW - MRO West | 7.6 | 6.9 | 8.9 | 8.8 | 9.3 | 9.1 | 8.6 | 8.8 | 8.8 |
| NEWE - NPCC New England | 15.7 | 13.1 | 14.3 | 16.7 | 13.1 | 15.5 | 12.5 | 12.6 | 16.7 |
| NYCW - NPCC NYC/Westchester | 19.9 | 16.9 | 19.6 | 21.5 | 18.9 | 20.3 | 17.5 | 17.9 | 21.5 |
| NYLI - NPCC Long Island | 18.1 | 16.6 | 21.8 | 24.3 | 20.4 | 22.5 | 18.1 | 19.1 | 24.3 |
| NYUP - NPCC Upstate NY | 11.6 | 12.6 | 14.4 | 16.6 | 13.2 | 15.4 | 12.6 | 12.8 | 16.6 |
| RFCE - RFC East | 12.2 | 10.9 | 12.4 | 15.7 | 12.9 | 14.3 | 11.3 | 11.2 | 15.7 |
| RFCM - RFC Michigan | 9.6 | 9.0 | 11.4 | 10.7 | 10.6 | 11.5 | 10.0 | 10.4 | 10.7 |
| RFCW - RFC West | 8.6 | 9.9 | 11.0 | 13.1 | 11.0 | 12.6 | 10.0 | 10.2 | 13.1 |
| SRDA - SERC Delta | 7.5 | 7.5 | 9.7 | 7.4 | 8.2 | 8.1 | 8.1 | 8.6 | 7.4 |
| SRGW - SERC Gateway | 7.8 | 7.0 | 9.6 | 11.7 | 9.1 | 10.6 | 7.7 | 8.5 | 11.7 |
| SRSE - SERC Southeastern | 9.1 | 8.5 | 10.3 | 10.9 | 10.4 | 10.6 | 9.8 | 10.4 | 10.9 |
| SRCE - SERC Central | 7.8 | 6.0 | 10.2 | 8.2 | 9.6 | 9.4 | 8.1 | 8.9 | 8.2 |
| SRVC - SERC VACAR | 8.6 | 8.3 | 11.2 | 10.1 | 10.6 | 10.1 | 10.0 | 10.6 | 10.1 |
| SPNO - SPP North | 7.9 | 7.5 | 8.9 | 10.4 | 9.0 | 9.6 | 8.1 | 8.7 | 10.4 |
| SPSO - SPP South | 6.9 | 8.5 | 10.4 | 12.7 | 9.8 | 11.4 | 9.0 | 9.5 | 12.7 |
| AZNM - WECC Southwest | 9.8 | 10.4 | 11.3 | 11.5 | 11.4 | 11.1 | 11.2 | 11.4 | 11.5 |
| CAMX - WECC California | 13.3 | 13.2 | 14.0 | 13.2 | 14.0 | 13.3 | 13.2 | 13.5 | 13.2 |
| NWPP - WECC Northwest | 7.0 | 5.2 | 8.4 | 5.6 | 7.8 | 6.2 | 7.5 | 7.8 | 5.6 |
| RMPA - WECC Rockies | 8.2 | 9.4 | 11.1 | 12.6 | 11.7 | 12.1 | 10.4 | 11.0 | 12.6 |
| U.S. Average | 9.8 | 9.4 | 11.3 | 11.9 | 11.1 | 11.6 | 10.2 | 10.6 | 11.9 |
| BCES/alternative case electricity price is 10-25 percent greater than the Reference case electricity price |
|||||||||
| BCES/alternative case electricity price is more than 25 percent above the Reference case electricity price | |||||||||
| Source: U.S. Energy Information Administration. National Energy Modeling System, runs refhall.d082611b, cesbingbk.d100611a, cesbingbkac.d100611a, cesbingbkrb.d100311a, cesbingbkpc.d100611a, cesbingbkc21.d100311b, cesbingbkc30.d100311a, cesbingbksc.d100611a. | |||||||||
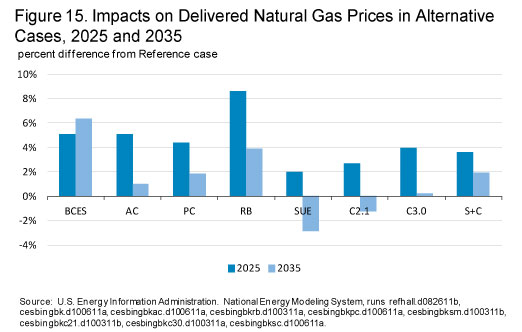 Natural gas price impacts are significant early in the projection period, but largely moderate by 2035 (Figure 15). In 2035, price impacts across cases are generally less than 5 percent, when compared to the Reference case. However, impacts on gas prices are generally more significant in the earlier years of the program. By 2025, impacts in three cases, All Clean, Revised Baseline, and Partial Credit, exceed 4 percent, with the Revised Baseline case exceeding 8 percent. Cases with reduced need for clean energy generation – the Small Utility Exemption case, the Standards and Codes case, and the two credit price cap cases – have more modest gas price impacts in the near-term. In 2025, only the Revised Baseline case, where natural gas generation in 2025 significantly exceeds the BCES case level, shows a larger impact on natural gas prices than the BCES case.
Footnotes
1The reference case in this report includes some revisions to the AEO2011 Reference case. The primary changes include an improved representation of interregional capacity transfers for reliability pricing and reserve margins. Also, capacity expansion decisions incorporate better foresight of future capital cost trends by including expectations of the commodity price index.