
EIA’s top accomplishments of 2021
For the U.S. Energy Information Administration (EIA), 2021 was a year of notable accomplishments. Check out these highlights of EIA products and programs this year.

Published an interactive mapping tool showing U.S. energy infrastructure, disruptions, and technologies
With the U.S. Energy Atlas, you can access useful energy infrastructure information through open source data and interactive web map applications. You can also combine our data with information from other sources to customize your own geospatial analysis.

Released analysis about how carbon fees could reduce energy-related CO2 emissions
In Analysis of Carbon Fee Runs Using the Annual Energy Outlook 2021, we explore three carbon fee cases in which carbon fees start respectively at $15.14, $25.23, and $35.33 per metric ton of CO2 in 2023 and grow by 5% each year to 2050. We focus on how the levels of U.S. energy-related CO2 emissions differ in these three cases over time compared with the Reference case in our previously published Annual Energy Outlook 2021.

Published supplemental reports to our short-term forecasts
We published two supplemental reports to our Short-Term Energy Outlook (STEO):
- In January, we published a supplemental report that discusses the effects of the COVID-19 pandemic on global oil consumption in 2020 and our estimates, forecasts, and expectations for oil consumption in 2021–22.
- In July, we published a supplemental report about how different temperatures affect not only the level of energy demand in the U.S. economic sectors, but also the carbon intensity of the sectors, depending on the relative sensitivity of coal and natural gas prices to changing demand.
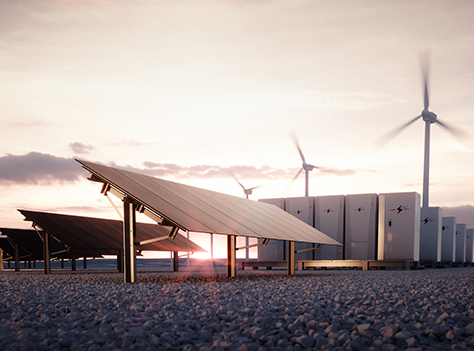
Released an update to our U.S. battery storage report
Our annual report on battery storage, Battery Storage in the United States: An Update on Market Trends, provides expanded data and analysis of battery storage and its increasing impact on the U.S. electric grid. “Growth in U.S. battery systems is critical as the United States faces new hurdles to reliable electricity delivery,” said EIA Acting Administrator Stephen Nalley. “Energy stored in batteries can react to second-to-second fluctuations in the electric grid, protecting grid power quality and improving the grid’s efficiency.”
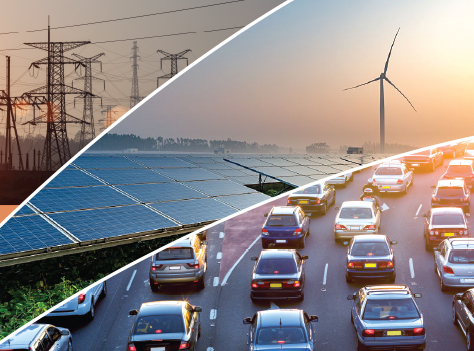
Published projections on U.S. energy trends through 2050, including the effects of the COVID-19 pandemic
Our Annual Energy Outlook 2021 (AEO2021) explored the long-term impact of the COVID-19 pandemic on the U.S. energy mix through 2050. In our ongoing effort to keep the public informed with current data amid uncertainty, we released the report at a virtual event with the Bipartisan Policy Center. In addition, AEO2021’s Reference case included estimates for the levelized cost of storage (LCOS) for the first time. We use LCOS along with the levelized cost of electricity and the levelized avoided cost of electricity to estimate the factors contributing to the capacity expansion decisions we modeled, among other metrics.

Tracked and reported on energy disruptions caused by extreme weather and cyberattack
As several extreme weather events affected large areas of the country, we published real time and retrospective analysis of these energy disruptions. In addition, we directed our customers to our many useful tools to track the impacts of disruption events on energy infrastructure and markets:
- We directed customers to our Southern California Daily Energy Report for up-to-date information on how drought and wildfires affected the local energy market.
- We published a Today in Energy article outlining our tools that were monitoring energy infrastructure in the path of Hurricane Ida.
- We published articles on how a cold-snap in Texas and surrounding areas changed electricity generation and demand, which, in turn, affected natural gas production, natural gas withdrawals from storage, and refinery operations; electricity prices; and energy supply and demand.
- We analyzed the impacts of the cyberattack that temporarily shut down the Colonial Pipeline.

Released data showing how U.S. commercial buildings consume, and sometimes produce, energy
This year we continued to publish key data for our 2018 Commercial Buildings Energy Consumption Survey (CBECS)—the only independent, statistically representative source for U.S. commercial building characteristics and energy use. CBECS provides building characteristics information for the estimated 5.9 million commercial buildings in the United States. Through the survey, we discovered that U.S. commercial buildings are getting larger, and they more commonly include LED lighting and emerging technologies such as electric vehicle charging stations. In spring 2022, we will publish preliminary estimates of energy consumption and expenditures for electricity, natural gas, fuel oil, and district heat based on the data collection for this survey.
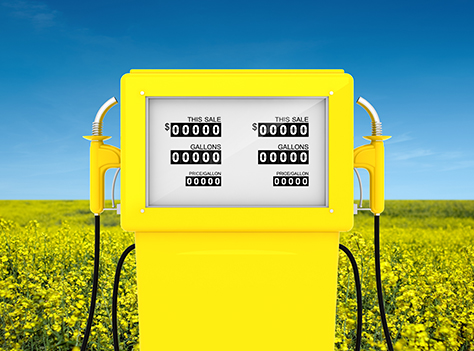
Began publishing regular data updates on the U.S. renewable fuels sector
On March 31, we released the first edition of our Monthly Biofuels Capacity and Feedstocks Update. This report will help our customers better track production capacities and feedstock consumption for biofuels and increase understanding of the effects of biofuels on the energy industry and our economy. We also modified petroleum and biofuel volumetric balances in the interactive Supply and Disposition summary data table in our Petroleum Navigator.

Published projections for global energy through 2050, including how COVID-19 affects the global energy sector
We presented our findings from the International Energy Outlook 2021 during a virtual event hosted by the Center for Strategic and International Studies (CSIS) on October 6. Acting Administrator Stephen Nalley and Assistant Administrator Angelina LaRose summarized the key highlights of the report, and a panel of EIA experts answered questions from the audience about what we expect during this 30-year projection.

Published new data on the manufacturing sector’s footprint on the U.S. energy sector
This year, we completed the data posting of our 2018 Manufacturing Energy Consumption Survey (MECS). MECS is a national sample survey that collects information on the stock of U.S. manufacturing establishments, their energy-related building characteristics, and their energy consumption and expenditures. We published our energy consumption, fuel-switching, and economic tables earlier this year. We also published tables containing data on prices and expenditures as well as ratios of fuel consumption per number of employees, dollar value added, and dollar value of shipments, among other data.

Collaborated with key stakeholders
We met with the American Statistical Association’s (ASA) Committee on Energy Statistics in September for the first time since before the pandemic. We have been meeting with the ASA committee annually since 1979, and these meetings are an opportunity for committee members to offer advice and suggestions for enhancements or alternative approaches to statistical and analytical methodology. Over the summer, our Commercial Buildings Energy Consumption Survey (CBECS) program convened experts from academia and federal energy labs for an informal, collaborative discussion to learn more about how CBECS data are used and to understand what has worked well for academic researchers. In November, we held a workshop to discuss U.S. natural gas prices, including any possible effects of our participation in international markets through LNG exports, with academic and industry participants. Also in November, we hosted an EIA Energy Storage Workshop to discuss the most recent trends, expectations, and needs for energy storage deployment in power markets. These and other meetings are part of our continued goal to stay connected with and learn from our stakeholders.

Marked 10 years of Today in Energy
This year marked the 10th year of our daily Today in Energy series, which provides topical, timely, short articles with energy news and information. Our stories have ranged from general energy information to in-depth explanations of our findings from our recent reports to timely analysis of current issues, such as the energy-relevant effects of hurricanes, wildfires, and the ongoing COVID-19 pandemic. Our most viewed article on record is an overview of different oil tanker sizes, which was posted in 2014.
Today in Energy is a primary example of our efforts to produce consistent, accurate, relevant, and readable content using Plain Language principles. These efforts are also supported by our newly revised EIA Writing Style Guide, which offers guidance on Plain Language, grammar, and EIA-specific style choices for our statistical and analytical publications.