
Natural gas storage likely to enter winter at lowest levels since 2005
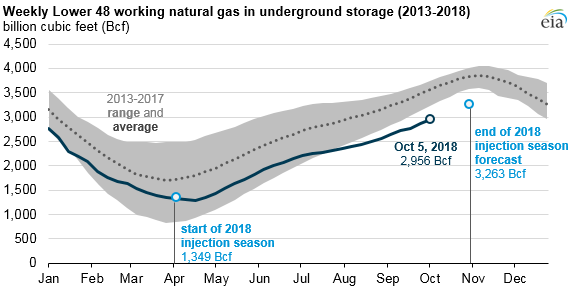
EIA forecasts that natural gas inventories will reach 3,263 billion cubic feet (Bcf) at the end of October in its recently released October Short-Term Energy Outlook (STEO), the lowest end-of-October level for U.S. natural gas inventories since 2005. Lingering cold temperatures in April 2018, the coldest April in the past 21 years, delayed the start of the natural gas storage refill season by about four weeks. Coupled with heavy natural gas withdrawals in January 2018, the delayed start to the refill season led to storage levels that have remained lower than the previous five-year minimum. However, late-season injections during the past four weeks have been close to their five-year averages, with injections averaging 81 Bcf compared with the five-year average of 82 Bcf.
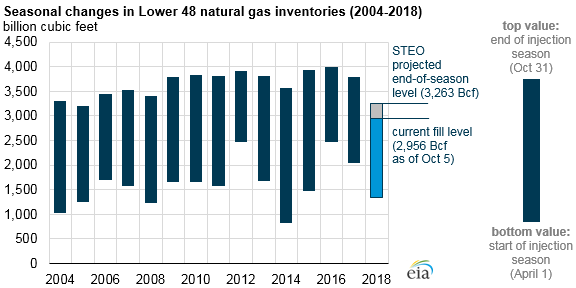
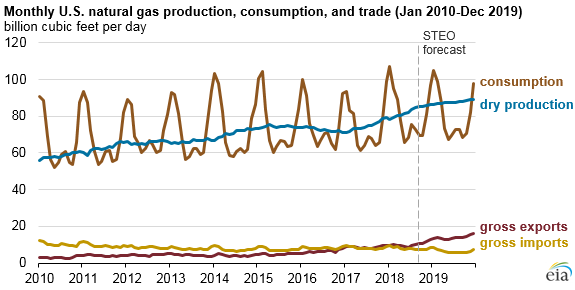
Natural gas storage is used to balance seasonal fluctuations in production and consumption. The greatest fluctuations in U.S. natural gas consumption are in the residential and commercial sectors, where natural gas is used as a heating fuel. Across all sectors, U.S. consumption of natural gas during winter months tends to be about 30% to 35% higher than in the spring and fall months, when temperatures are relatively mild.
Natural gas is withdrawn from storage facilities throughout the United States during times of high demand and injected into storage facilities during times of low demand. Traditionally, the injection season lasts from the beginning of April through the end of October, though natural gas is now regularly injected through October and into early November in the United States. In 2018, relatively cold winter weather led to more withdrawals from storage, and inventories transitioned from being near the previous five-year average to being lower than average. By mid-July, inventory levels fell to lower than the previous five-year range for that time of year.
Increases in U.S. domestic production of natural gas and the buildout of infrastructure to deliver it to consumers may have reduced the need for operators to store as much natural gas. EIA projects that U.S. dry natural gas production will average a record 82.7 Bcf/d in 2018, an 11% increase from 2017. With production outpacing domestic consumption, the United States has transitioned to being a net exporter of natural gas. EIA expects U.S. gross exports of natural gas to average 10.1 Bcf/d in 2018, a 16% increase from the previous year, with most of the growth in exports of liquefied natural gas.
EIA projects that spot natural gas prices at the Henry Hub benchmark will average $2.99/million British thermal units (MMBtu) in 2018, virtually identical to 2017. In the STEO, annual average Henry Hub natural gas prices are expected to increase slightly to $3.12/MMBtu in 2019.
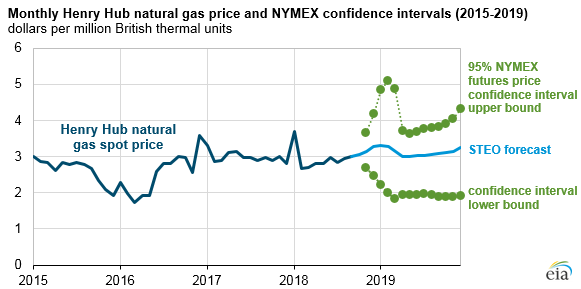
In the past, relatively low natural gas inventories have coincided with relatively high prices, but recent changes in U.S. natural gas markets have kept prices relatively low and stable. The steady increase in U.S. production in 2018 has suppressed natural gas futures market prices, despite record consumption of natural gas in the electric power sector this summer and increasing U.S. exports of liquefied natural gas. In addition to production increases, new pipeline infrastructure in the Northeast and South Central regions has enabled natural gas shipments directly from production centers to demand centers, further reducing the need for maintaining high inventory levels.
Principal contributor: Naser Ameen