Liquefied natural gas exports expected to drive growth in U.S. natural gas trade
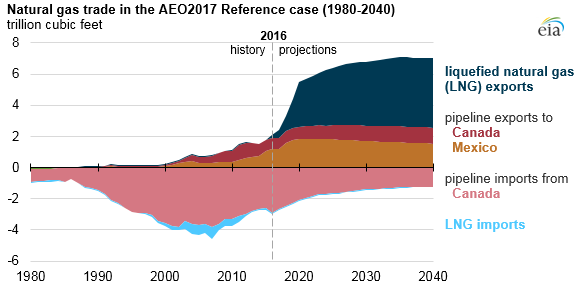
The United States is expected to become a net exporter of natural gas on an average annual basis by 2018, according to the recently released Annual Energy Outlook 2017 (AEO2017) Reference case. The transition to net exporter is driven by declining pipeline imports, growing pipeline exports, and increasing exports of liquefied natural gas (LNG). In most AEO2017 cases, the United States is also projected to become a net exporter of total energy in the 2020s in large part because of increasing natural gas exports.
In 2016, the United States was a net importer of natural gas, with net imports of 0.9 trillion cubic feet (Tcf), or 2.6 billion cubic feet per day (Bcf/d). As several LNG export projects currently under construction are completed, LNG exports are expected to make up a growing share of natural gas exports and to surpass pipeline exports of natural gas by 2020.
The Sabine Pass facility in Louisiana became the first operating LNG export facility in the Lower 48 states in 2016. By 2021, four LNG export facilities currently under construction are expected to be completed. Combined, these five plants are expected to have an operational export capacity of 9.2 billion cubic feet per day. After 2021, projected U.S. exports of LNG grow at a more modest rate as U.S. natural gas faces growing competition from other global LNG suppliers.
U.S. exports of natural gas by pipeline to Mexico are also expected to increase. U.S. exports to Mexico have doubled since 2009 and are projected to continue rising through at least 2020 as pipeline projects currently under construction are completed.
U.S. imports of natural gas, most of which come by pipeline from western Canada, are projected to continue declining. In addition to importing less natural gas from Canada, primarily from Alberta, increasing amounts of natural gas from the Marcellus and Utica basins in the Northeast and Midwest regions of the United States are expected to flow to eastern Canadian provinces.
Despite these trends, the United States is expected to remain a net importer of natural gas by pipeline from Canada through 2040 in all but one case in the AEO2017 analysis. In the High Oil and Gas Resource and Technology case, higher natural gas production leads to greater exports of natural gas, and the United States becomes a net exporter of natural gas by pipeline to Canada by 2030.
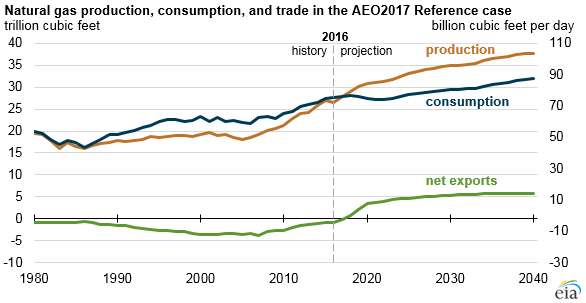
The growth of natural gas exports, especially from new LNG terminals, sustains continued growth in U.S. natural gas production. In the Reference case, natural gas production is projected to grow through 2020 at about the same rate (3.6% annual average) as it has since 2005, when production of natural gas from shale formations began to grow rapidly. After 2020, natural gas production grows at a lower rate (1.0% annual average) in the Reference case as net export growth moderates, energy efficiencies increase, and natural gas prices slowly rise.
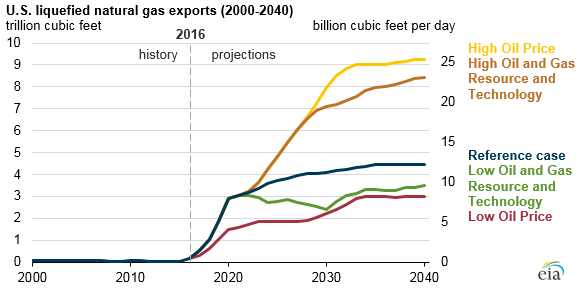
Natural gas production and trade vary with different assumptions for resources and technology, macroeconomic growth, and world oil prices. In the High Oil and Gas Resource and Technology case, larger natural gas resource estimates and improved drilling technology lead to higher domestic natural gas production, lower U.S. natural gas prices, and therefore, greater natural gas exports. Most of the increase in natural gas trade is from LNG exports, which grow to 8.4 Tcf (23 Bcf/d) in 2040.
However, LNG exports are highest in a case with high world oil prices. In the High Oil Price case, when consumers move away from petroleum products when other energy sources become economically favorable, global LNG demand increases and U.S. LNG exports reach 9.2 Tcf, or 25 Bcf/d. Compared with other LNG suppliers, U.S. LNG has the advantage of domestic spot prices that are less sensitive to global oil prices.
Conversely, in a scenario with more pessimistic assumptions for oil and gas resources and technology or a scenario with low world oil prices, LNG exports still increase, but remain below Reference case levels through 2040.
More information about expectations for trade, production, and consumption of natural gas and other fuels is available in EIA’s Annual Energy Outlook 2017.
Principal contributor: Katie Dyl