
U.S. energy trade with Mexico: U.S. export value more than twice import value in 2016
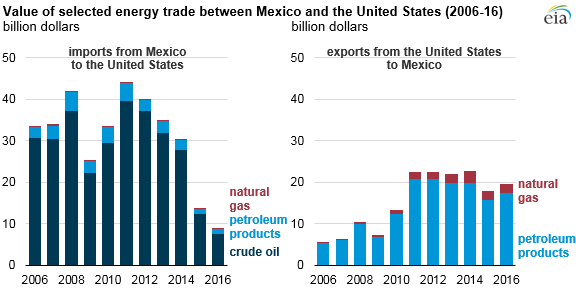
Energy trade between Mexico and the United States has historically been driven by Mexico’s sales of crude oil to the United States and by U.S. net exports of refined petroleum products to Mexico. Through 2014, Mexico’s exports of crude oil to the United States were the most valuable component of bilateral energy trade, with the overall value of Mexico’s U.S. crude oil sales far exceeding the value of U.S. net sales of petroleum products, primarily gasoline and diesel fuel, to Mexico. From 2006 through 2010, for example, the value of U.S. energy imports from Mexico were two to three times greater than the value of U.S. energy exports to Mexico.
The bilateral energy trade situation with Mexico has changed significantly in recent years. In 2015 and 2016, the value of U.S. energy exports to Mexico, including rapidly growing volumes of both petroleum products and natural gas, exceeded the value of U.S. energy imports from Mexico as volumes of Mexican crude oil sold in the United States continued to decline. For 2016, the value of U.S. energy exports to Mexico was $20.2 billion, while the value of U.S. energy imports from that country was $8.7 billion.
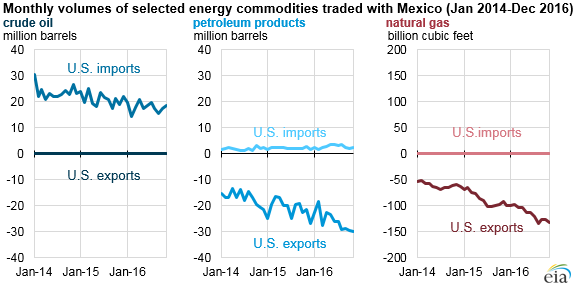
Import and export values each reflect commodity volumes and their prices. Monthly trends in volumes through 2016 showed increasing U.S. petroleum product and natural gas exports to Mexico, with a generally declining trend in U.S. crude oil imports from Mexico.
Mexico is second only to Canada in energy trade with the United States. Based on the latest annual data from the U.S. Census Bureau, energy accounted for about 9% of all U.S. exports to Mexico and 3% of all U.S. imports from Mexico in 2016.
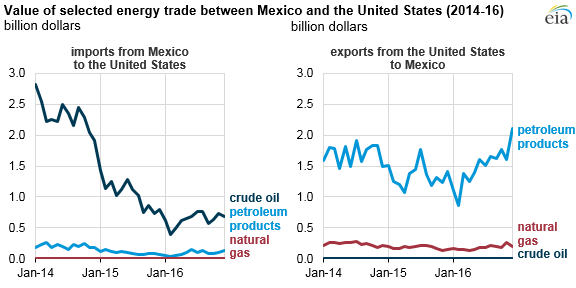
Crude oil makes up most of the energy imports from Mexico, averaging 688,000 barrels per day (b/d) in 2015 and 588,000 b/d in the first 11 months of 2016. In 2015, Mexico was the source of 9% of crude oil imported by the United States, providing the fourth-largest share behind Canada, Saudi Arabia, and Venezuela. From 2006 through 2014, U.S. crude oil imports from Mexico were valued at an annual average of about $30 billion, but more recently, as both the volume of crude oil imports from Mexico and world oil prices declined, U.S. crude oil imports from Mexico were valued at $12.5 billion in 2015 and $7.6 billion in 2016. Mexico’s total crude oil exports have been declining as its oil production falls. Because Mexico has been sending more oil to countries in Europe and Asia, crude oil exports to the United States have been declining more rapidly than overall crude oil exports.
Petroleum products account for most of the value of energy exports from the United States to Mexico. In 2015, Mexico was the destination for 690,000 b/d of petroleum products, or 16% of all petroleum products exported from the United States. These exports were valued at more than $16 billion. In 2015, even though the United States exported more petroleum products to Mexico than in 2014, the value of those products was lower because of lower prices for fuels such as gasoline, distillate fuel oil, and liquefied petroleum gases.
In the first 11 months of 2016, petroleum product exports rose in both volume (averaging 849,000 b/d) and value relative to the first 11 months of 2015. Changes in Mexico’s utilization of petroleum refineries have created a widening gap between its domestic supply and demand, and U.S. gasoline exports now make up more than half of Mexico’s gasoline consumption. Compared with petroleum product exports, 2016 petroleum product imports from Mexico to the United States were relatively small, accounting for about 87,000 b/d and valued at $0.9 billion through November.
Bilateral natural gas trade is dominated by pipeline shipments between the United States and Mexico. U.S. natural gas exports to Mexico totaled nearly 2.9 billion cubic feet per day (Bcf/d) in 2015, or almost 60% of all U.S. natural gas exports, and are growing rapidly. Based on data through November, U.S. natural gas exports to Mexico averaged 3.8 Bcf/d in 2016, and reports indicate that daily flows during early 2017 are already exceeding 4.2 Bcf/d.
In 2017 and 2018, natural gas pipelines currently under construction or in the planning stages are expected to nearly double the pipeline natural gas exporting capacity from the United States to Mexico. Much of this natural gas will likely be used to generate electricity, as Mexico’s energy ministry expects to add significant natural gas-fired electricity generating capacity through 2029.
Principal contributor: Owen Comstock