
Many natural gas-fired power plants under construction are near major shale plays
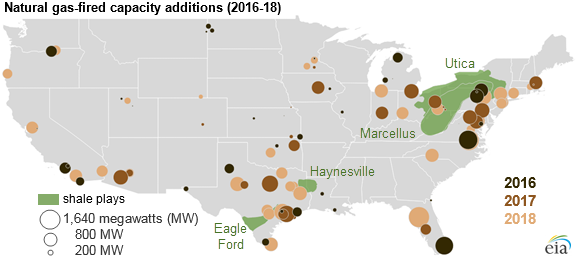
Note: Natural gas-fired capacity additions include plants completed and under construction.
Natural gas-fired power generation increased 19% in 2015, because of low natural gas prices, increased gas-fired generation capacity, and coal power plant retirements. EIA's May 2016 Short-Term Energy Outlook forecasts that this year, natural gas-fired generation will exceed coal generation in the United States on an annual basis.
Growth in natural gas-fired generation capacity is expected to continue over the next several years, as 18.7 gigawatts (GW) of new capacity comes online between 2016 and 2018. Many of the new natural gas-fired capacity additions in development are near major shale gas plays. The Mid-Atlantic states and Texas have the most natural gas-fired capacity additions under construction with planned online dates within the next three years (2016–18).
Mid-Atlantic states. Many of the natural gas capacity additions are concentrated around the Marcellus and Utica shale regions, largely located in Pennsylvania, West Virginia, and Ohio. These states have been leading the growth in U.S. natural gas production over the past several years, driven by increasing production in the Marcellus and Utica shales. Natural gas infrastructure has been added in these regions to transport natural gas to population centers along the Atlantic Coast. Among the states near the Marcellus and Utica shales, Virginia accounts for the largest cumulative additions of gas-fired capacity over the 2016–18 period, with 2.3 GW of gas-fired capacity under construction, followed by Ohio with 1.9 GW, Pennsylvania with 1.8 GW, and Massachusetts with 0.7 GW, according to EIA's Electric Power Monthly.
Expanding pipeline networks in the Northeast are increasing takeaway capacity from the Marcellus and Utica shales, which will support the growth in natural gas-fired generating capacity. In 2015, 6.0 billion cubic feet per day (Bcf/d) of new pipeline takeaway capacity in the Northeast was commissioned to transport natural gas to the east, south, and west of the Marcellus and Utica shales. In 2016, 2.2 Bcf/d of new pipeline capacity currently under construction is scheduled to come online in the Northeast, according to EIA data on natural gas pipeline infrastructure.
Texas. Significant levels of natural gas-fired capacity are under construction in Texas, with 3.2 GW expected to become operational over 2016–18. Texas produces more natural gas than any other state and is home to several major shale plays, including the Eagle Ford and Barnett shales.
Florida has the largest cumulative additions of gas-fired capacity currently under construction, with three plants that have a combined capacity of 3.8 GW expected to come online in 2016–18. Although the state has no shale gas production, the retirement of older, less-efficient coal units and the replacement of some oil-fired capacity have led to the expansion of regional pipeline networks to bring more shale gas to serve gas-fired generation.
The cumulative capacity additions cited above include plants that are under construction. The Mid-Atlantic states and Texas also have the most regulatory permit filings for new gas-fired capacity additions. Their combined received and pending permits amount to a cumulative 12.1 GW over the 2016–18 period. Texas leads the United States in permit filings, with received and pending permits to construct a cumulative 6.6 GW over the 2016–18 period.
Principal contributor: Victoria Zaretskaya
Tags: electricity, generating capacity, map, natural gas, production/supply, states, Texas