Cost of transporting coal to power plants rose almost 50% in decade
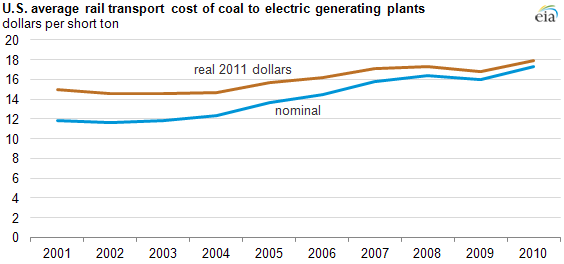
The average cost of shipping coal by railroad to power plants increased almost 50% in the United States from 2001 to 2010. Railroad transport accounts for more than 70% of U.S. coal destined to the electric power sector, so changes in rail rates can have an important impact on the cost of coal delivered to power plants. Though they vary significantly, transportation costs accounted for 40% of the average overall cost of coal delivered at electric power plants in 2010.
On average, nominal U.S. rail rates for shipping coal grew from $11.83 to $17.25 per short ton from 2001 to 2010. Rates grew slowly in the beginning of the decade before increasing almost 11% in 2005, then continuing to grow at a relatively robust pace until the recession. However, the impact of the recession on transportation rates was short-lived as rates grew more than 9% in 2010.
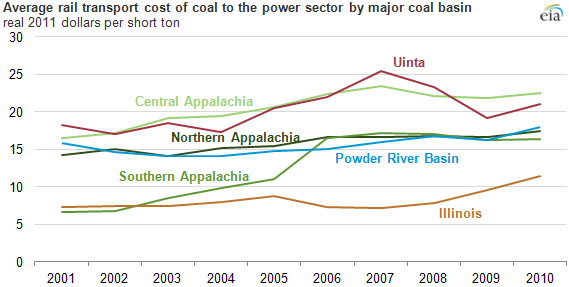
National numbers can be misleading, however, as regional dynamics tend to vary considerably among the six major coal basins. For example, Southern Appalachian coal costs increased more than 10% annually in 2001-10, while Powder River Basin (PRB) rates grew 1.5% over the same period. For a few PRB destination states, rates fell during this period.
The wide range in minemouth coal prices and transportation distances across the United States create significant variation in the impact of transportation rates on overall coal costs, with different basins affected to significantly differing degrees. While rail transportation costs for Appalachian and Illinois Basin coals as a percent of total delivered cost fall in the low 20% range, the relatively low commodity cost of PRB coal, and the long distances it travels, results in transportation costs that averaged almost 60% of the total delivered cost in 2010—more than the commodity itself.
State-level data show further variation in rate changes over 2001-2010. At the high and low ends, Virginia-to-Tennessee rates grew 83% while Wyoming-to-Kansas rates fell 23%—a 106 percentage point swing.
For more information and extensive data, see EIA's full report on Coal Transportation Rates to the Electric Power Sector.
Tags: coal, electricity, rail, states, transportation, utility