Key New England natural gas pipeline reflects seasonal flow changes
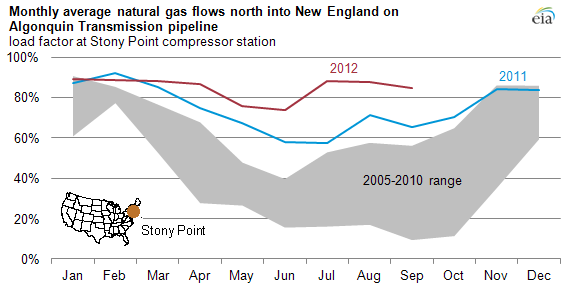
The Algonquin Gas Transmission (AGT) Company, a main source of natural gas supply into New England, has traditionally operated near capacity only during the high-demand winter season. But so far in 2012, it has operated at much higher levels year-round as rising natural gas demand from the power sector, coupled with reduced liquefied natural gas (LNG) imports, have increased flows on pipelines into the region.
From June-August 2012, AGT averaged a winter-like 83% load factor (the amount of pipeline capacity that is being used). This is up from a 62% load factor for June-August 2011 and well above the average load factor of only 32% from June-August in the years 2005-2010.

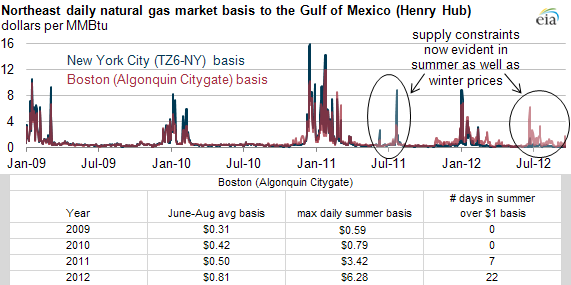
Northeast natural gas prices frequently increase in winter, as high demand and supply constraints separate local prices from the U.S. Gulf region (this separation is commonly referred to as "basis", or the price difference between a natural gas trading location and the Henry Hub in Louisiana). But short periods of higher prices have also occurred in the last two summers. In the Boston area, average daily summer basis (June-August) has increased every year, from a $0.31 per million British thermal units ($/MMBtu) average in 2009 to an $0.81/MMBtu average in 2012. In addition, the highest summer basis level has increased every year as well, from a $0.59/MMBtu maximum in 2009 to $6.28/MMBtu in 2012. The number of over-$1/MMBtu basis days hit 22 days this summer, up from seven days in 2011. There were no over-$1/MMBtu basis days in the summers of 2009 or 2010. Similarly, pipeline supply constraints have also affected spot prices at Marcellus trading point. Transportation costs to New York City could be reduced with the approved expansion of the existing Texas Eastern Transmission pipeline from Linden, New Jersey to Manhattan, New York.
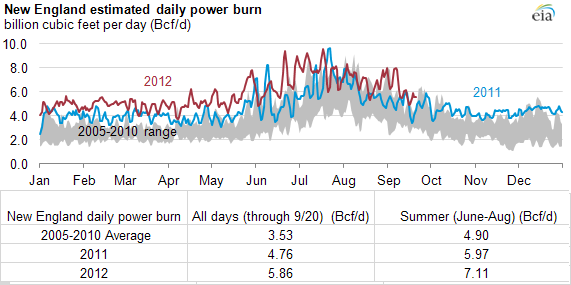
A major factor of the year-round higher pipeline capacity utilization into New England is the increased amount of natural gas used at power plants, referred to as power burn. So far in 2012 (Jan 1-Sept 20), power burn has averaged 5.86 billion cubic feet per day (Bcf/d), 66% above the 2005-2010 average. Summer power burn (June-August) averaged 7.11 Bcf/d in 2012, a 45% increase from the 2005-2010 average. The consistently higher level of natural gas use at power plants places additional pressure on pipelines to serve those customers while balancing maintenance and outage schedules, which are typically performed during periods of lower natural gas demand.
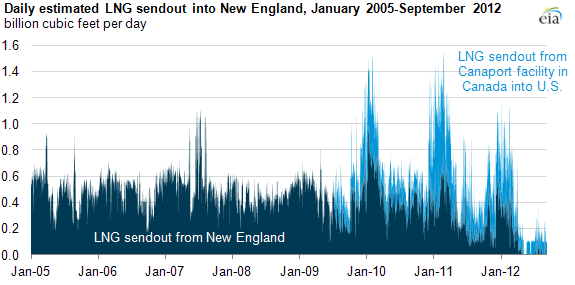
Note: New England terminal sendout includes volumes from Everett, Neptune, and Northeast Gateway. The Canaport facility is in New Brunswick, Canada, but mainly serves the U.S. natural gas market.
Liquefied natural gas (LNG) deliveries into New England have been declining in recent years, as low domestic prices provide an unattractive market to LNG shippers. LNG sendout into New England averaged about 0.5 Bcf/d from June to August 2005-2010. This level dipped slightly to about 0.43 Bcf/d during the summer of 2011 and over half of that (54%) arrived via the the Canaport LNG facility in New Brunswick, Canada, which began commercial operation in July 2009. But this summer, total LNG sendout into New England averaged only 0.11 Bcf/d, and there were periods in the first half of May and early June where little LNG entered the New England market.