Crude oil prices peaked early in 2012
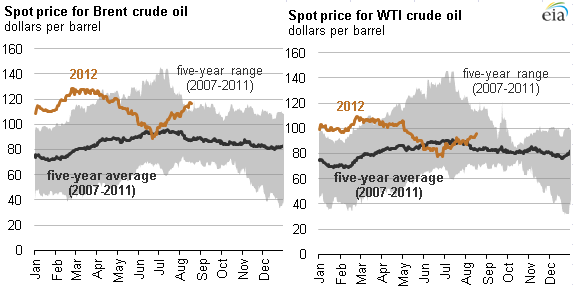
Crude oil prices rose during the first quarter of 2012 as concerns about possible international supply disruptions pushed up petroleum prices. Prices then fell during the second quarter before turning sharply upward at the start of the third quarter.
Both Brent and U.S. West Texas Intermediate (WTI) crude oil started 2012 above $100 per barrel and reached a peak in early March of just over $125 per barrel for Brent and almost $110 per barrel for WTI as positive economic news that could lead to stronger oil demand and worries about supply disruptions linked to Iran's nuclear program contributed to higher prices. Crude oil prices fell during the second quarter due, in part, to concerns about lower oil demand with a slowdown of the global economy. By the end of June, oil prices were down almost 30% from their peak to just under $78 per barrel for WTI and $91 per barrel for Brent.
Some of the major factors that influenced crude oil prices during the first half of 2012 were:
- Changes in global economic growth expectations. Strong job growth data in the U.S., lower interest rates for several European countries and increased manufacturing data in China all contributed to increased expectations for economic growth and higher crude oil prices during the first quarter of this year. A reversal of these factors in the second quarter helped push crude oil prices to their 2012 lows.
- Oil supply disruptions. Production disruptions such as those in Syria, Sudan, and Yemen took about 1 million barrels of oil per day off the world market, raising oil prices.
- Iran sanctions. Ongoing U.S. and European sanctions on imports of Iranian oil intended to pressure Iran to give up its nuclear program (1) played a part in reducing Iran's oil exports, and (2) raised fears that Iran would retaliate by disrupting oil shipments through the Strait of Hormuz. Both caused oil prices to rise.
- Rising oil production. U.S. oil production topped 6 million barrels per day in early 2012, the highest level since 1998, and contributed to building U.S. crude oil inventories that put downward pressure on oil prices.
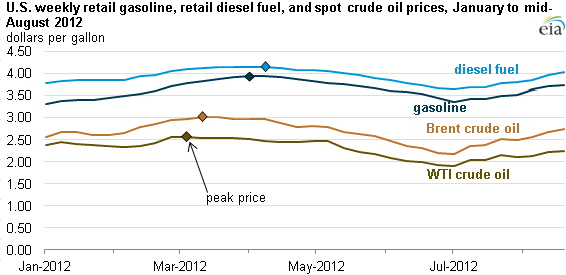
The rise and fall of crude oil prices were reflected at the pump as gasoline and diesel prices followed the movements of oil costs, which accounted for almost two-thirds of the price for motor fuels. For every $1 per barrel change in oil prices, consumers are expected eventually to see a 2.4-cent-per-gallon change in retail gasoline and diesel prices, if everything else remains the same.
Gasoline prices increased for the first 14 weeks of 2012 (except for one week) to a peak of $3.94 per gallon in early April and then fell for 13 weeks in a row to $3.36 per gallon at the beginning of July, the lowest pump price so far in 2012 since $3.30 per gallon during the first week of January. (See chart below)
Diesel fuel prices followed a similar path, increasing for 15 weeks (except for three weeks) to a peak of $4.15 per gallon, followed by 12 straight weeks of falling prices to a low of $3.65 per gallon. The higher price for diesel versus gasoline reflected stronger domestic diesel demand compared to gasoline consumption and record U.S. diesel exports to help satisfy rising international demand for diesel.