
EIA has updated Gulf of Mexico energy statistics
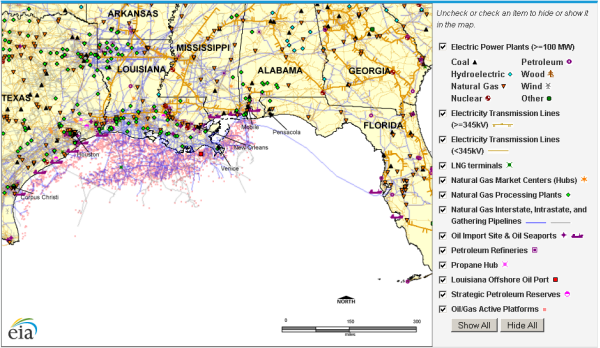
The U.S. Energy Information Administration has updated energy statistics and an interactive map that highlights the role of the Gulf of Mexico in the U.S. energy picture. The Gulf of Mexico (GOM) area, both onshore and offshore, is one of the most important regions in the United States for energy resources and infrastructure. In 2011, the Gulf of Mexico federal offshore region accounted for about 23% of total U.S. crude oil production and about 7% of total U.S. dry natural gas production.
The interactive energy infrastructure map contains information on power plants, storage terminals, pipelines, petroleum refineries, liquefied natural gas terminals, natural gas processing facilities, and electricity transmission lines in and around the Gulf of Mexico. Users may select the types of energy facilities to show or hide on the map.
EIA's GOM Fact Sheet also includes updated statistics related to petroleum and other liquids supply, natural gas supply, refining capacity, natural gas plant capacity, and proved reserves.
Total domestic production of crude oil and natural gas increased in 2011, despite decreases in Gulf of Mexico federal offshore production of 15% for crude oil and approximately 19% for dry natural gas. Refineries along the Gulf coast comprised about 44% of total U.S. petroleum refining capacity, as of January 2012. Gulf coast natural gas processing plants accounted for 30% of total U.S. natural gas processing plant capacity, as of January 2012.
The updated GOM Fact Sheet can help analysts assess this region's resources and infrastructure in light of potential tropical storm activity or other events. The Climate Prediction Center at the National Oceanic and Atmospheric Administration (NOAA) has forecasted near-normal tropical storm activity for the 2012 hurricane season, which for the Atlantic region runs from June 1 to November 30. As of August 7, 2012, NOAA has declared seven named storms or hurricanes in the Atlantic region: Alberto, Beryl, Chris, Debby, Ernesto, Florence, and Gilma.