2011 Brief: Henry Hub natural gas spot prices fell about 9% in 2011
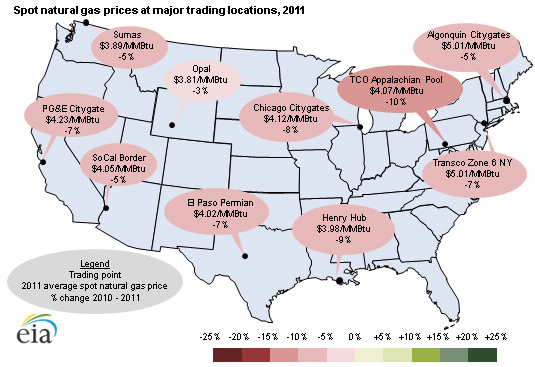
Note: Average spot natural gas prices reported in the map for 2011 are based on data from InterContinentalExchange and vary slightly values reported in the current Short-Term Energy Outlook, which are based on Reuters data.
This article continues a series of briefs on energy market trends in 2011.
Wholesale spot natural gas prices in most areas of the United States fell slightly in 2011 from the previous year. Prices at the Henry Hub, a key benchmark location for pricing throughout the United States, fell 9% to about $4 per million British thermal units in 2011, the second lowest annual average price since 2002. Strong gains in domestic natural gas production—gross withdrawals were up about 6% through October 2011—especially in the Marcellus and some liquids-rich plays like Eagle Ford, contributed to low average spot natural gas prices.
The Northeast had the highest average natural gas prices in 2011—slightly over $5 per MMBtu—due to on-going pipeline constraints, especially during extremely cold or hot weather. Nevertheless, Northeast prices fell on average about 5-7% in 2011. Price spikes in Boston and New York were generally cold-weather related, but the hot summer played a role in high July prices (see chart).
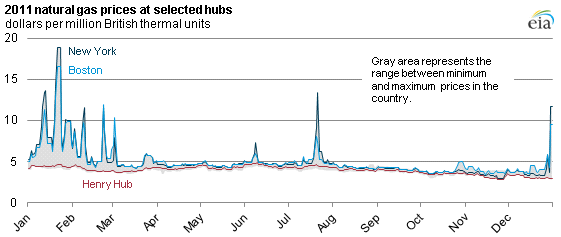
Note: The chart shows Boston and New York daily spot prices in comparison to the range of maximum and minimum prices at major trading hubs in other (non-Northeastern) parts of the lower-48 states.
In other markets, PG&E prices were generally at the high end of the range, while Rockies prices (Opal Hub) were usually at the low end of the range.
Transportation differentials, also called basis spreads (the difference between a regional price and the Henry Hub price), narrowed considerably for Rockies market locations in 2011 compared with 2010 due to increases in take-away natural gas pipeline capacity and slowing regional production. In New York and Boston, basis spreads rose in 2011 compared to 2010.
Other highlights of 2011:
- Freeze-offs contributed to substantial losses in onshore production in February, as frigid temperatures brought production down below 57 billion cubic feet per day (Bcf/d) from around 62 Bcf/d.
- Overall, EIA estimates about 11.3 billion cubic feet per day of new natural gas pipeline capacity started commercial service in the United States in 2011. Some of the key pipeline expansions included the Ruby Pipeline, the Tennessee Line 300 project, and the Florida Gas Transmission Phase VIII Expansion project.
- Inventories of working natural gas in storage remained below both the five-year (2006-2010) average and 2010 levels for most of the injection season (March-October). However, near the end of the season, injections increased rapidly, bringing storage to a new weekly record high of 3,852 Bcf, according to EIA's Weekly Natural Gas Storage Report.