Future U.S. tight oil and shale gas production depends on resources, technology, markets
Based on projections in the U.S. Energy Information Administration's Annual Energy Outlook 2016 (AEO2016), U.S. tight oil production is expected to reach 7.08 million barrels per day (b/d), and shale gas production is expected to reach 79 billion cubic feet per day (Bcf/d) in 2040. These values reflect Reference case projections, while several side cases with different assumptions of oil prices, technological advances, and resource availability have different levels of tight oil and shale gas production.
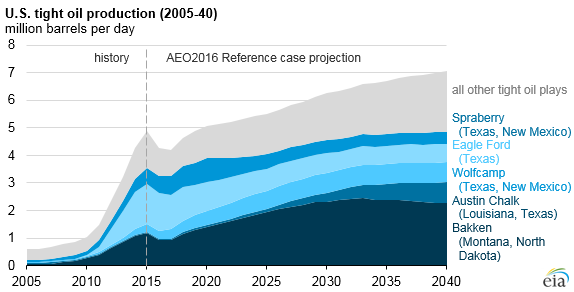
U.S. production of tight oil and shale gas has increased significantly from 2010 to 2015, driven by technological improvements that have reduced drilling costs and improved drilling efficiency in major shale plays, such as the Bakken, Marcellus, and Eagle Ford.
Production from tight oil in 2015 was 4.89 million barrels per day, or 52% of total U.S. crude oil production. From 2015 to 2017, tight oil production is projected to decrease by 700,000 barrels per day in the Reference case, mainly attributed to low oil prices and the resulting cuts in investment. However, production declines will continue to be mitigated by reductions in cost and improvements in drilling techniques. The use of more efficient hydraulic fracturing techniques and the application of multiwell-pad drilling, as well as changes in well completion designs, will allow producers to recover greater volumes from a single well.
As oil prices recover, oil production from tight formations is expected to increase. By 2019, Bakken oil production is projected to reach 1.3 million b/d, surpassing the Eagle Ford to become the largest tight oil-producing formation in the United States. The Bakken, which spans 37,000 square miles in North Dakota and Montana, has a technically recoverable resource of 23 billion barrels of tight oil that can be produced based on current technology, industry practice, and geologic knowledge. Bakken production is projected to reach 2.3 million barrels per day by 2040, almost a third of the projected U.S. total tight oil production.
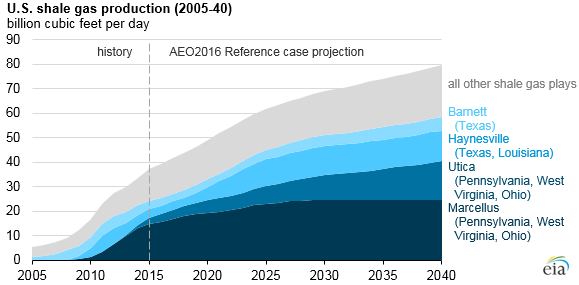
Natural gas production from shale gas plays in 2015 accounted for 37.4 billion cubic feet per day (Bcf/d), or 50% of total U.S. natural gas production. Unlike production from tight oil, which declines in the near term before increasing later in the forecast period, natural gas production from shale gas plays is expected to increase through 2040 in the AEO2016 Reference case.
The two Appalachian shale gas plays, the Marcellus and Utica, have factors favorable for production: shallower geologic formation depths and proximity to consuming markets. Both Appalachian shale gas plays have remained resilient to the low natural gas prices and are projected to continue to drive total U.S. production in the long term. Shale gas production in these plays is expected to reach more than 40 Bcf/d by 2040, providing just over half of U.S. total shale gas production.
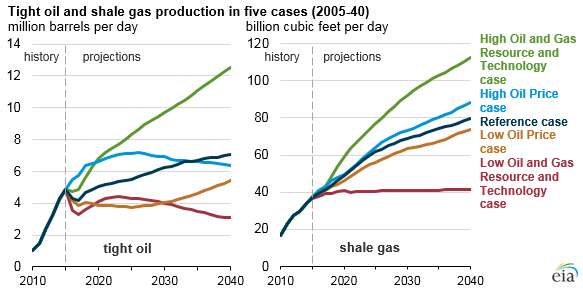
Two oil price side cases illustrate the effect of higher or lower global crude oil prices on production from tight formations. By 2040, the global benchmark Brent crude oil spot price averages $73/b in the Low Oil Price case, $136/b in the Reference case, and $230/b in the High Oil Price case. In the High Oil Price case, drilling activities increase tight oil production through 2026, after which it begins to decline. The opposite is true in the Low Oil Price case, where tight oil production declines slightly before increasing after 2026. Production of shale gas increases in both the High and Low Oil Price cases.
In the resource and technology side cases, the estimated ultimate recovery for shale gas and tight oil wells in the United States is 50% higher or 50% lower than in the Reference case. Rates of technological improvement that reduce costs and increase productivity in the United States are also 50% higher or 50% lower than in the Reference case. By 2040, these cases result in the greater differences from Reference case production values than do the alternative oil price cases.
Principal contributors: Danya Murali, Faouzi Aloulou