EIA produces new maps of the Utica Shale play
Note: Click to enlarge.
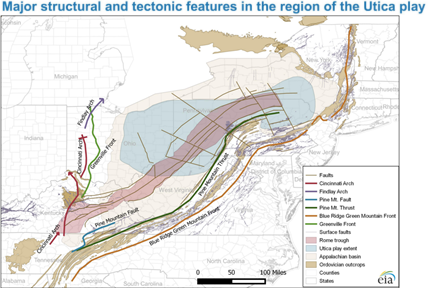
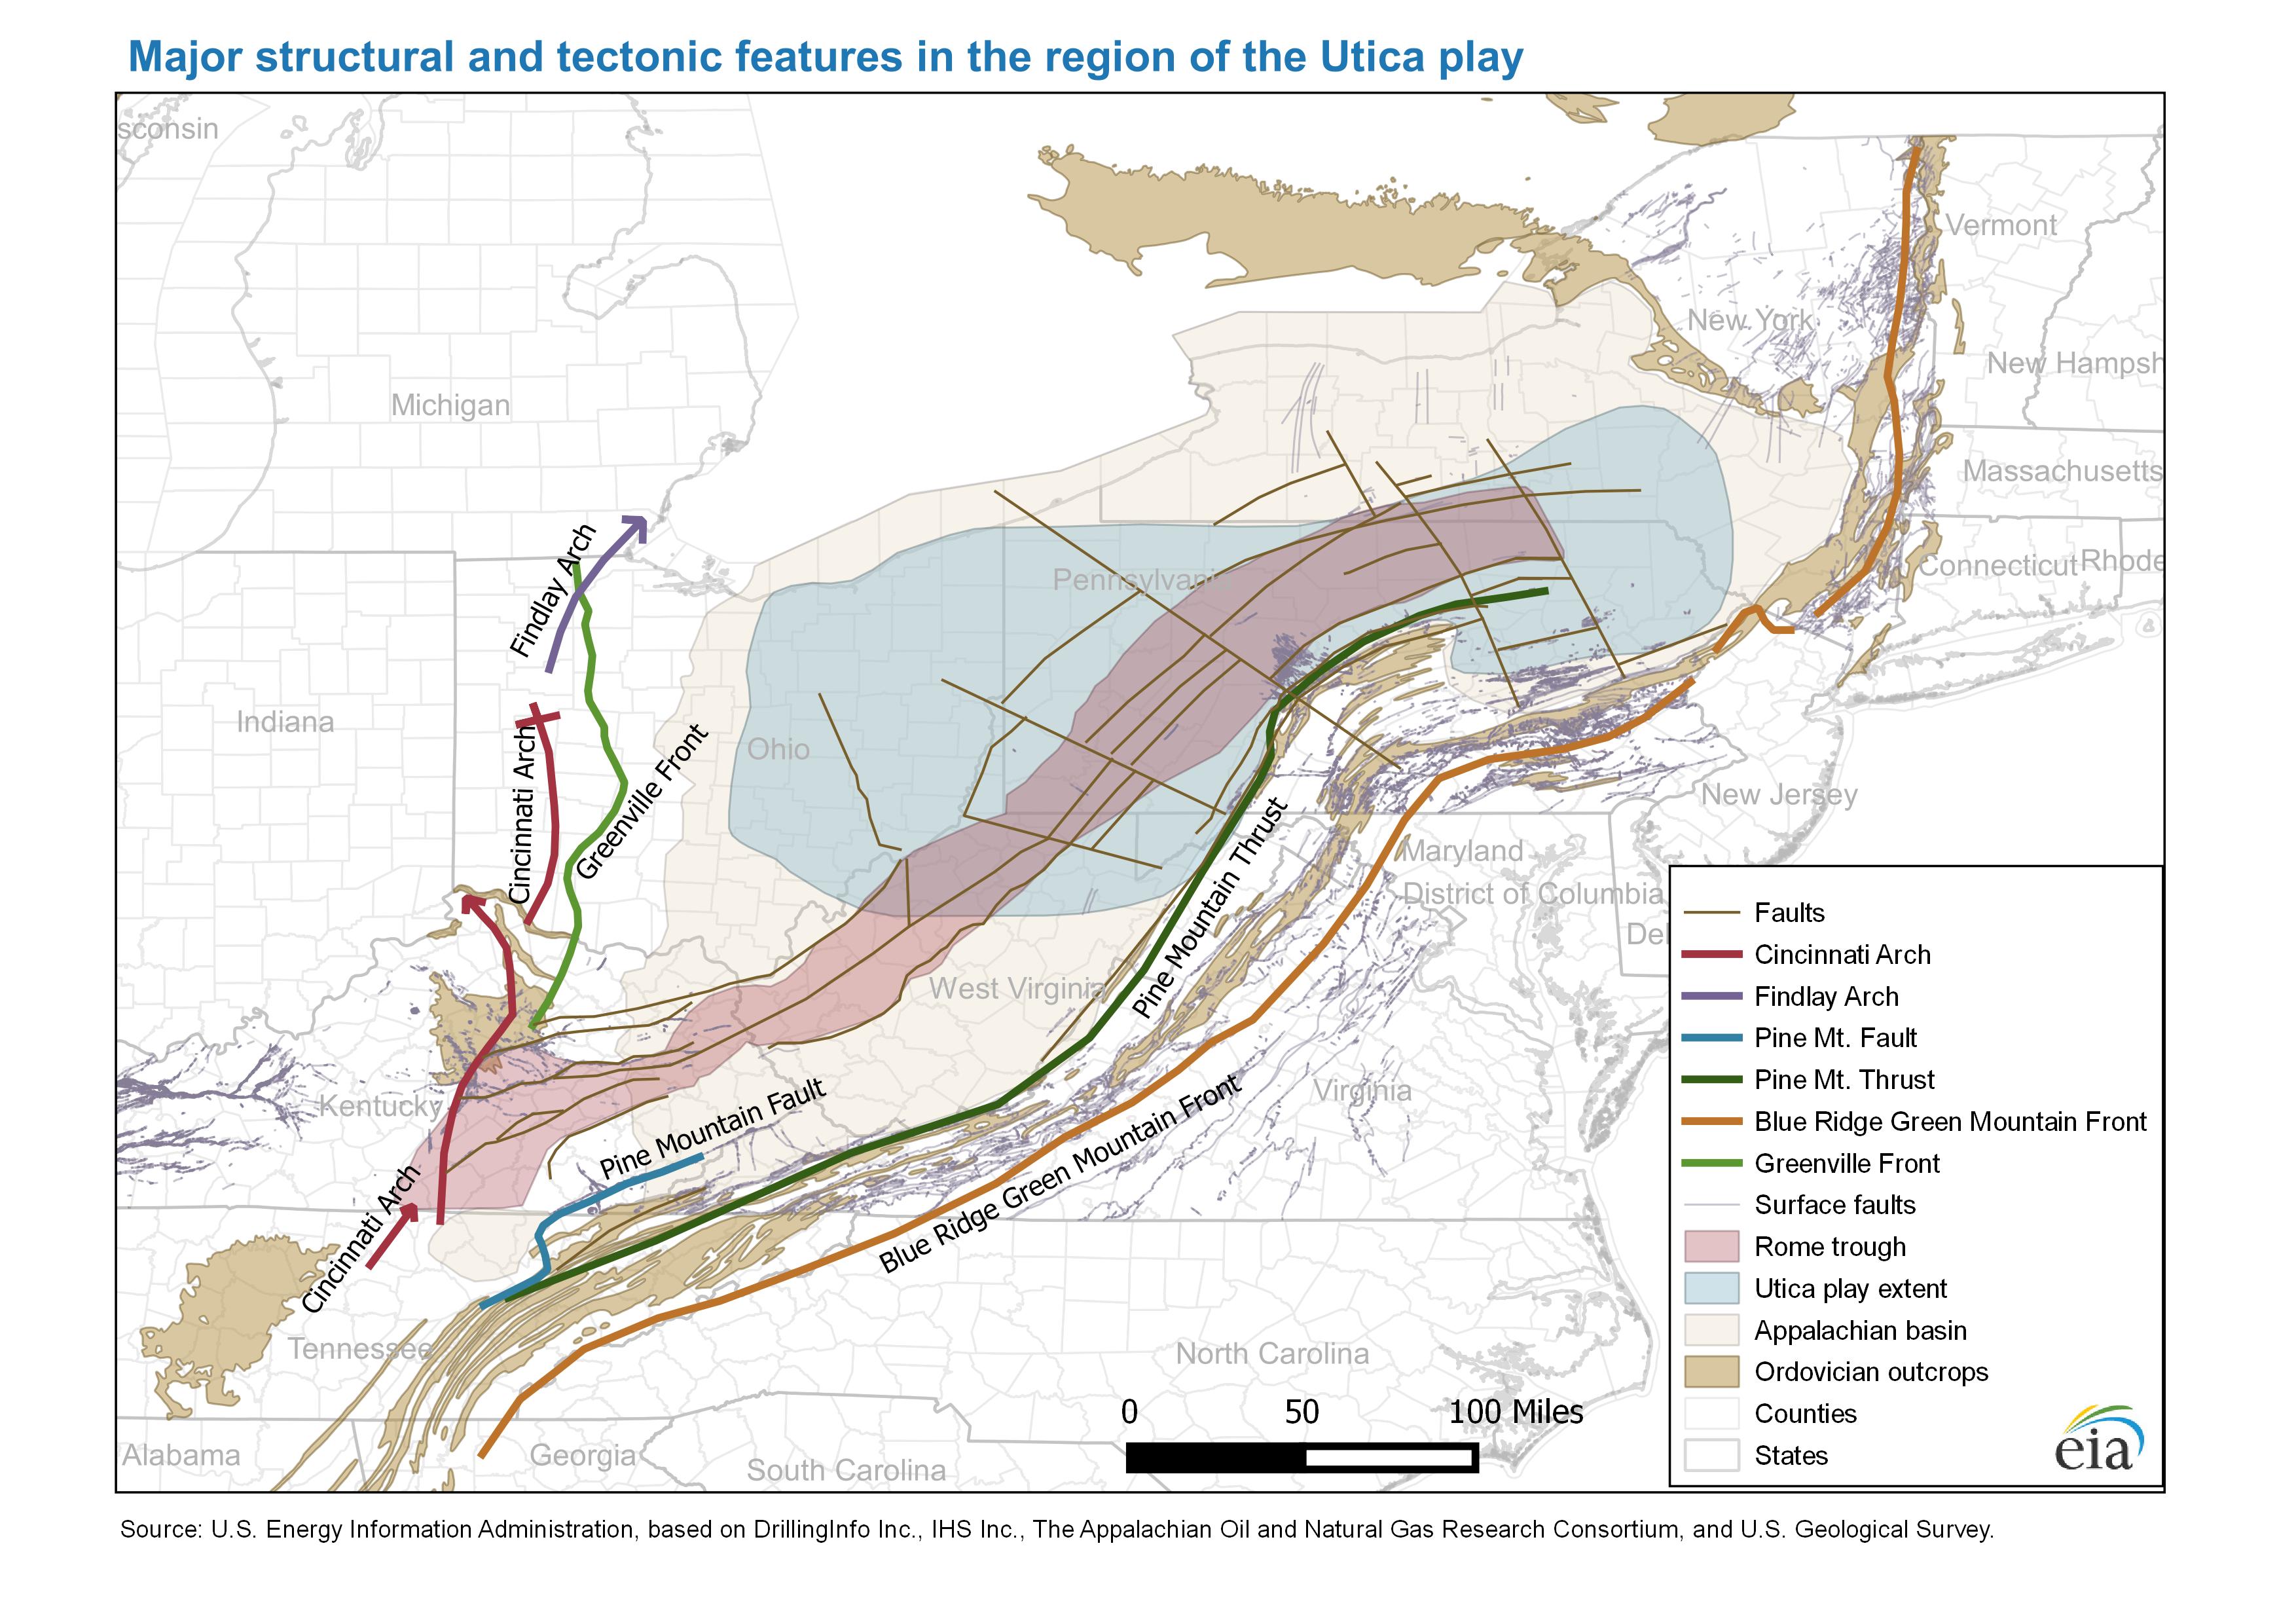
The U.S. Energy Information Administration has produced new maps that show the structure, thickness, and geologic setting of the Utica Shale play and the location of production wells. Production of oil and natural gas from the Utica play has increased since 2011, with more than 1,700 wells drilled as of January 2016. The Utica play includes both the Utica formation and the deeper Point Pleasant formation, each with its own characteristics.
The Utica play spans about 60,000 square miles across Ohio, West Virginia, Pennsylvania, and New York. The geologic characteristics of the Utica and Point Pleasant formations, which are discussed in EIA's update, are favorable for the accumulation and production of hydrocarbons.
The Utica map is one of several maps of low-permeability hydrocarbon formations that EIA updated with additional geologic detail. EIA has previously published updated maps of major geological and tectonic features for the Marcellus and Eagle Ford plays. EIA has also provided shapefiles for structure and thickness maps for the following: Marcellus, Eagle Ford, Abo-Yeso, Bone Spring, Delaware, Glorieta-Yeso, Spraberry, Bakken, Three Forks, and Niobrara.
Source: U.S. Energy Information Administration, based on DrillingInfo, Inc., IHS Inc., the Appalachian Oil and Natural Research Consortium, and U.S. Geological Survey
Note: Click to enlarge.
Source: U.S. Energy Information Administration, based on DrillingInfo, Inc., IHS Inc., the Appalachian Oil and Natural Research Consortium, and U.S. Geological Survey
Note: Click to enlarge.
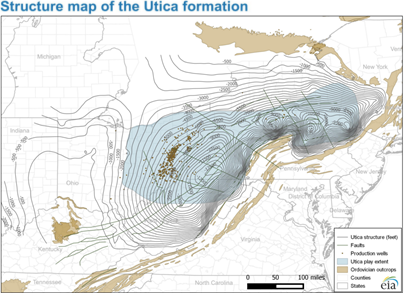
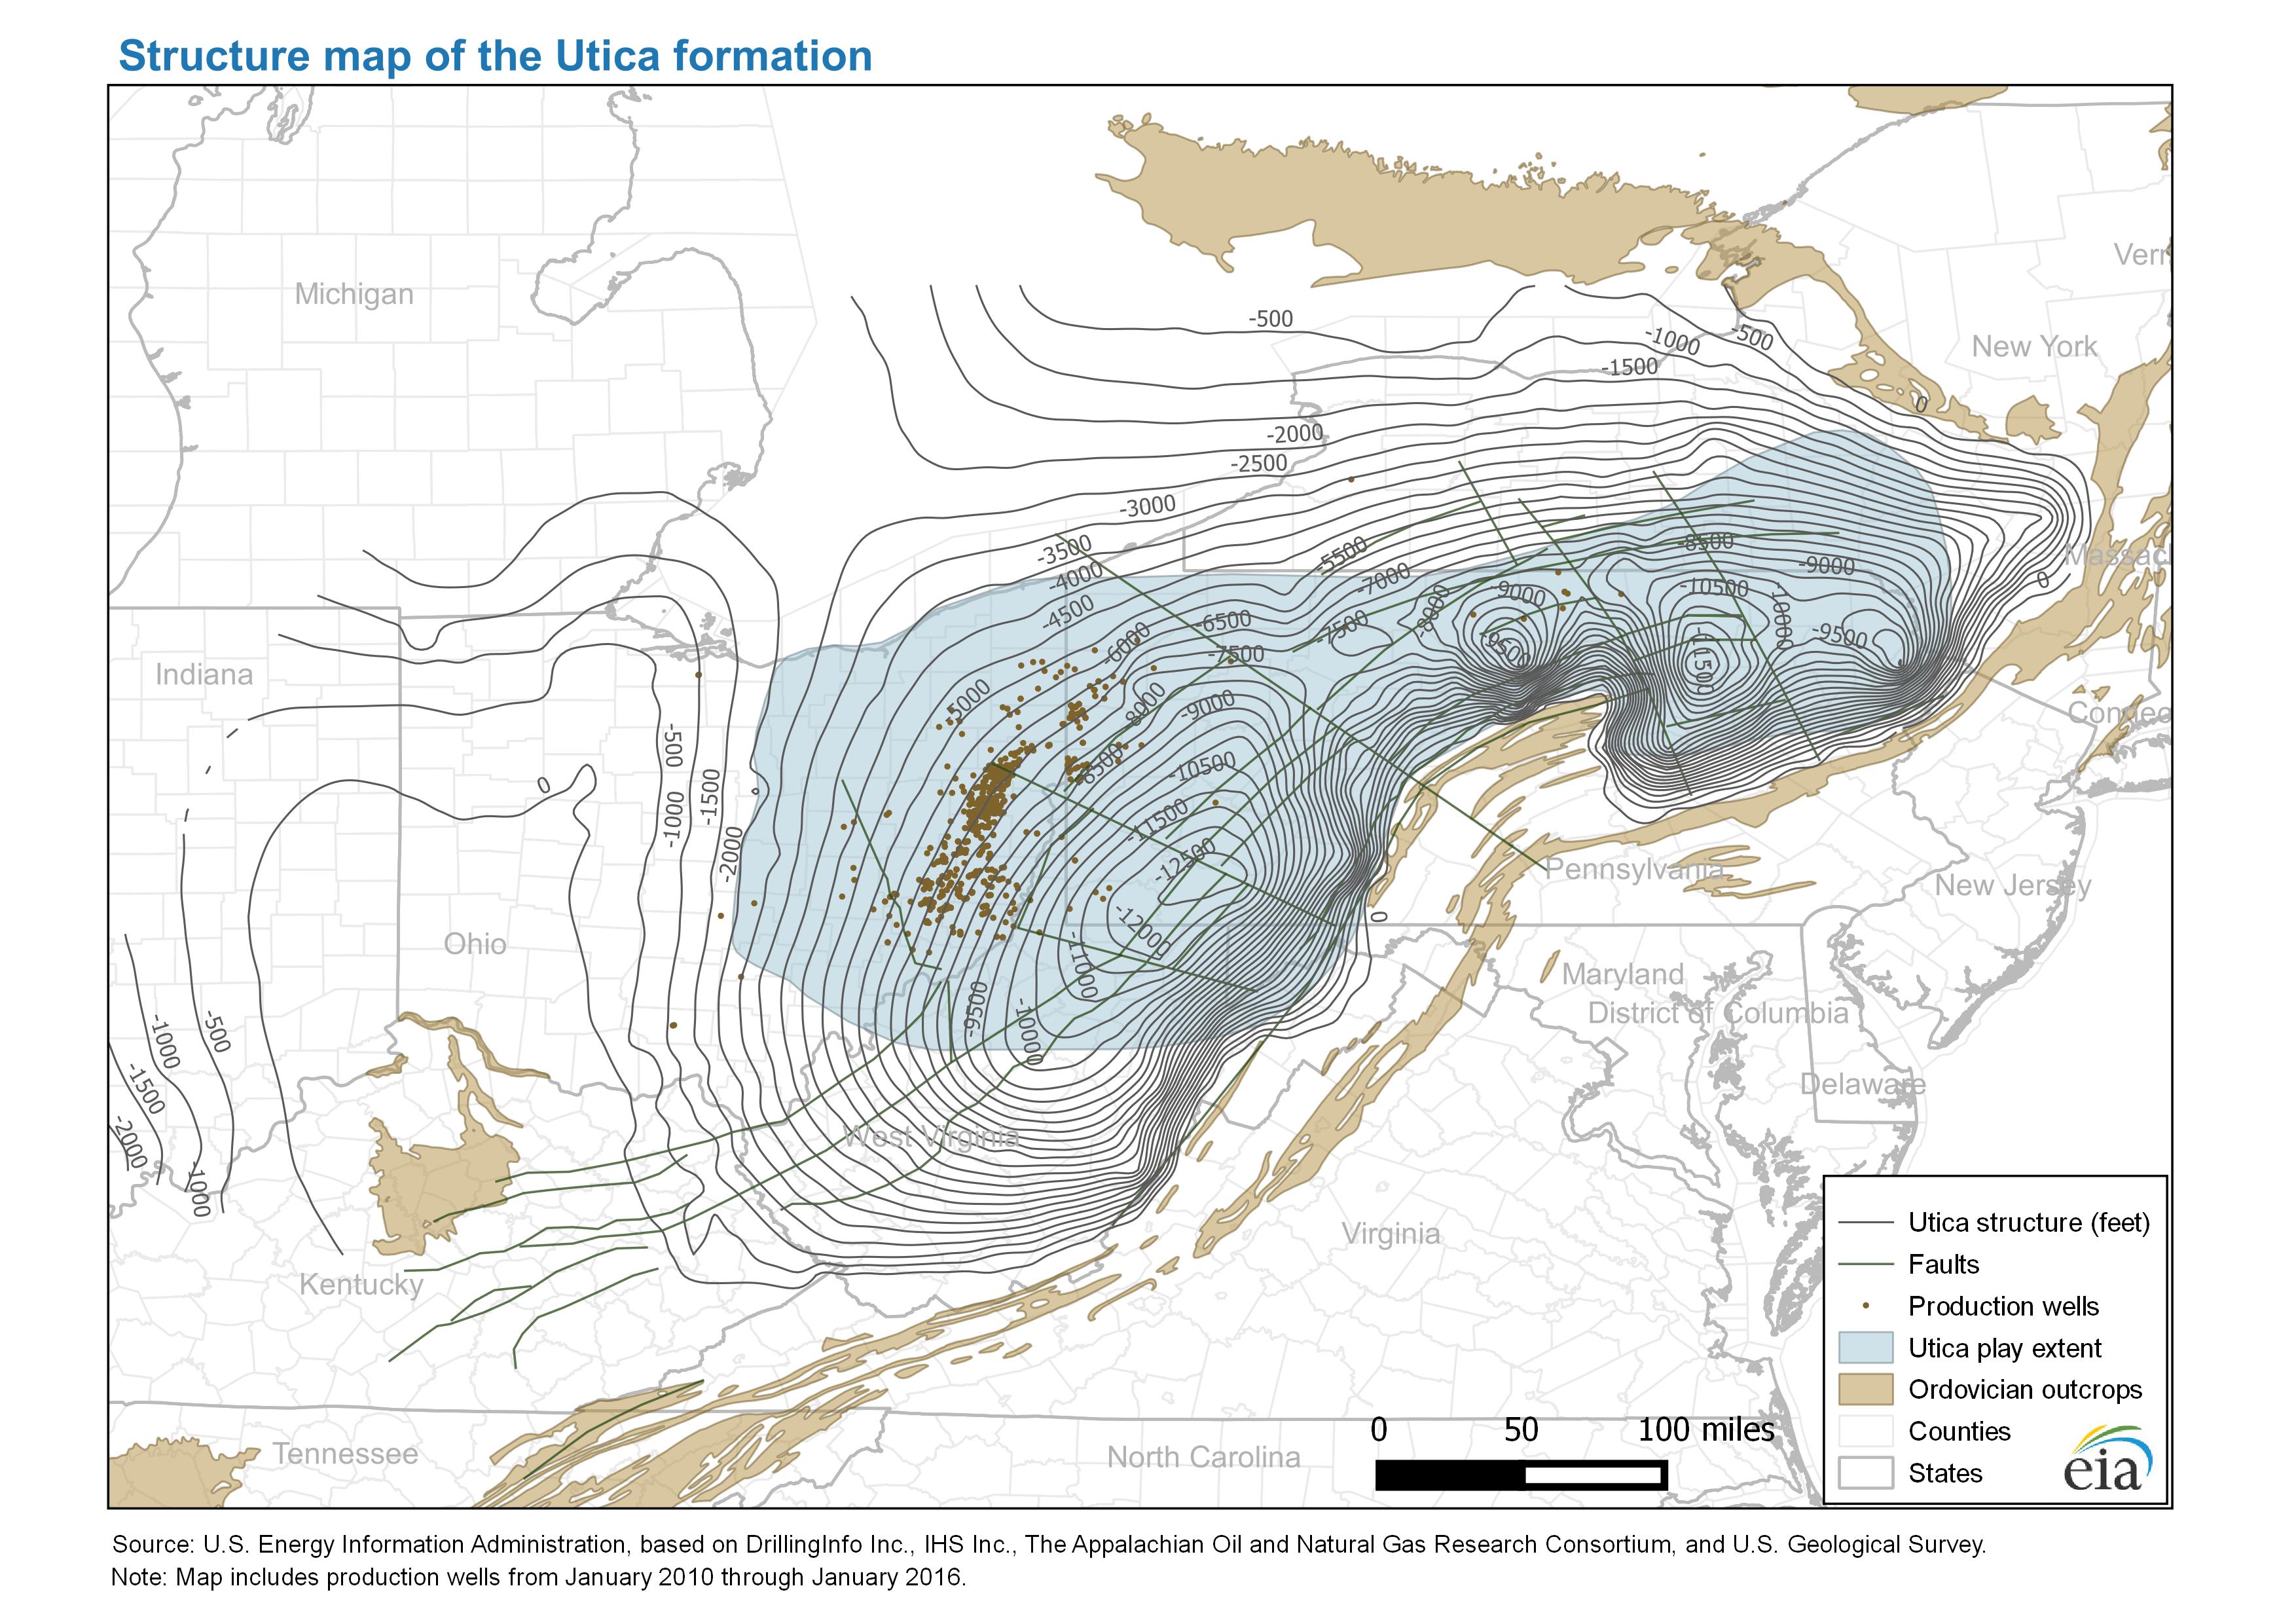
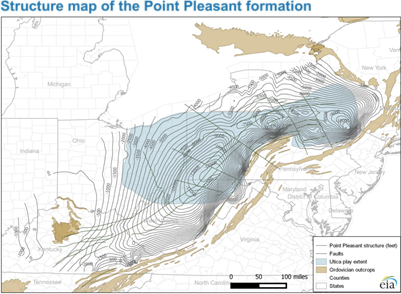
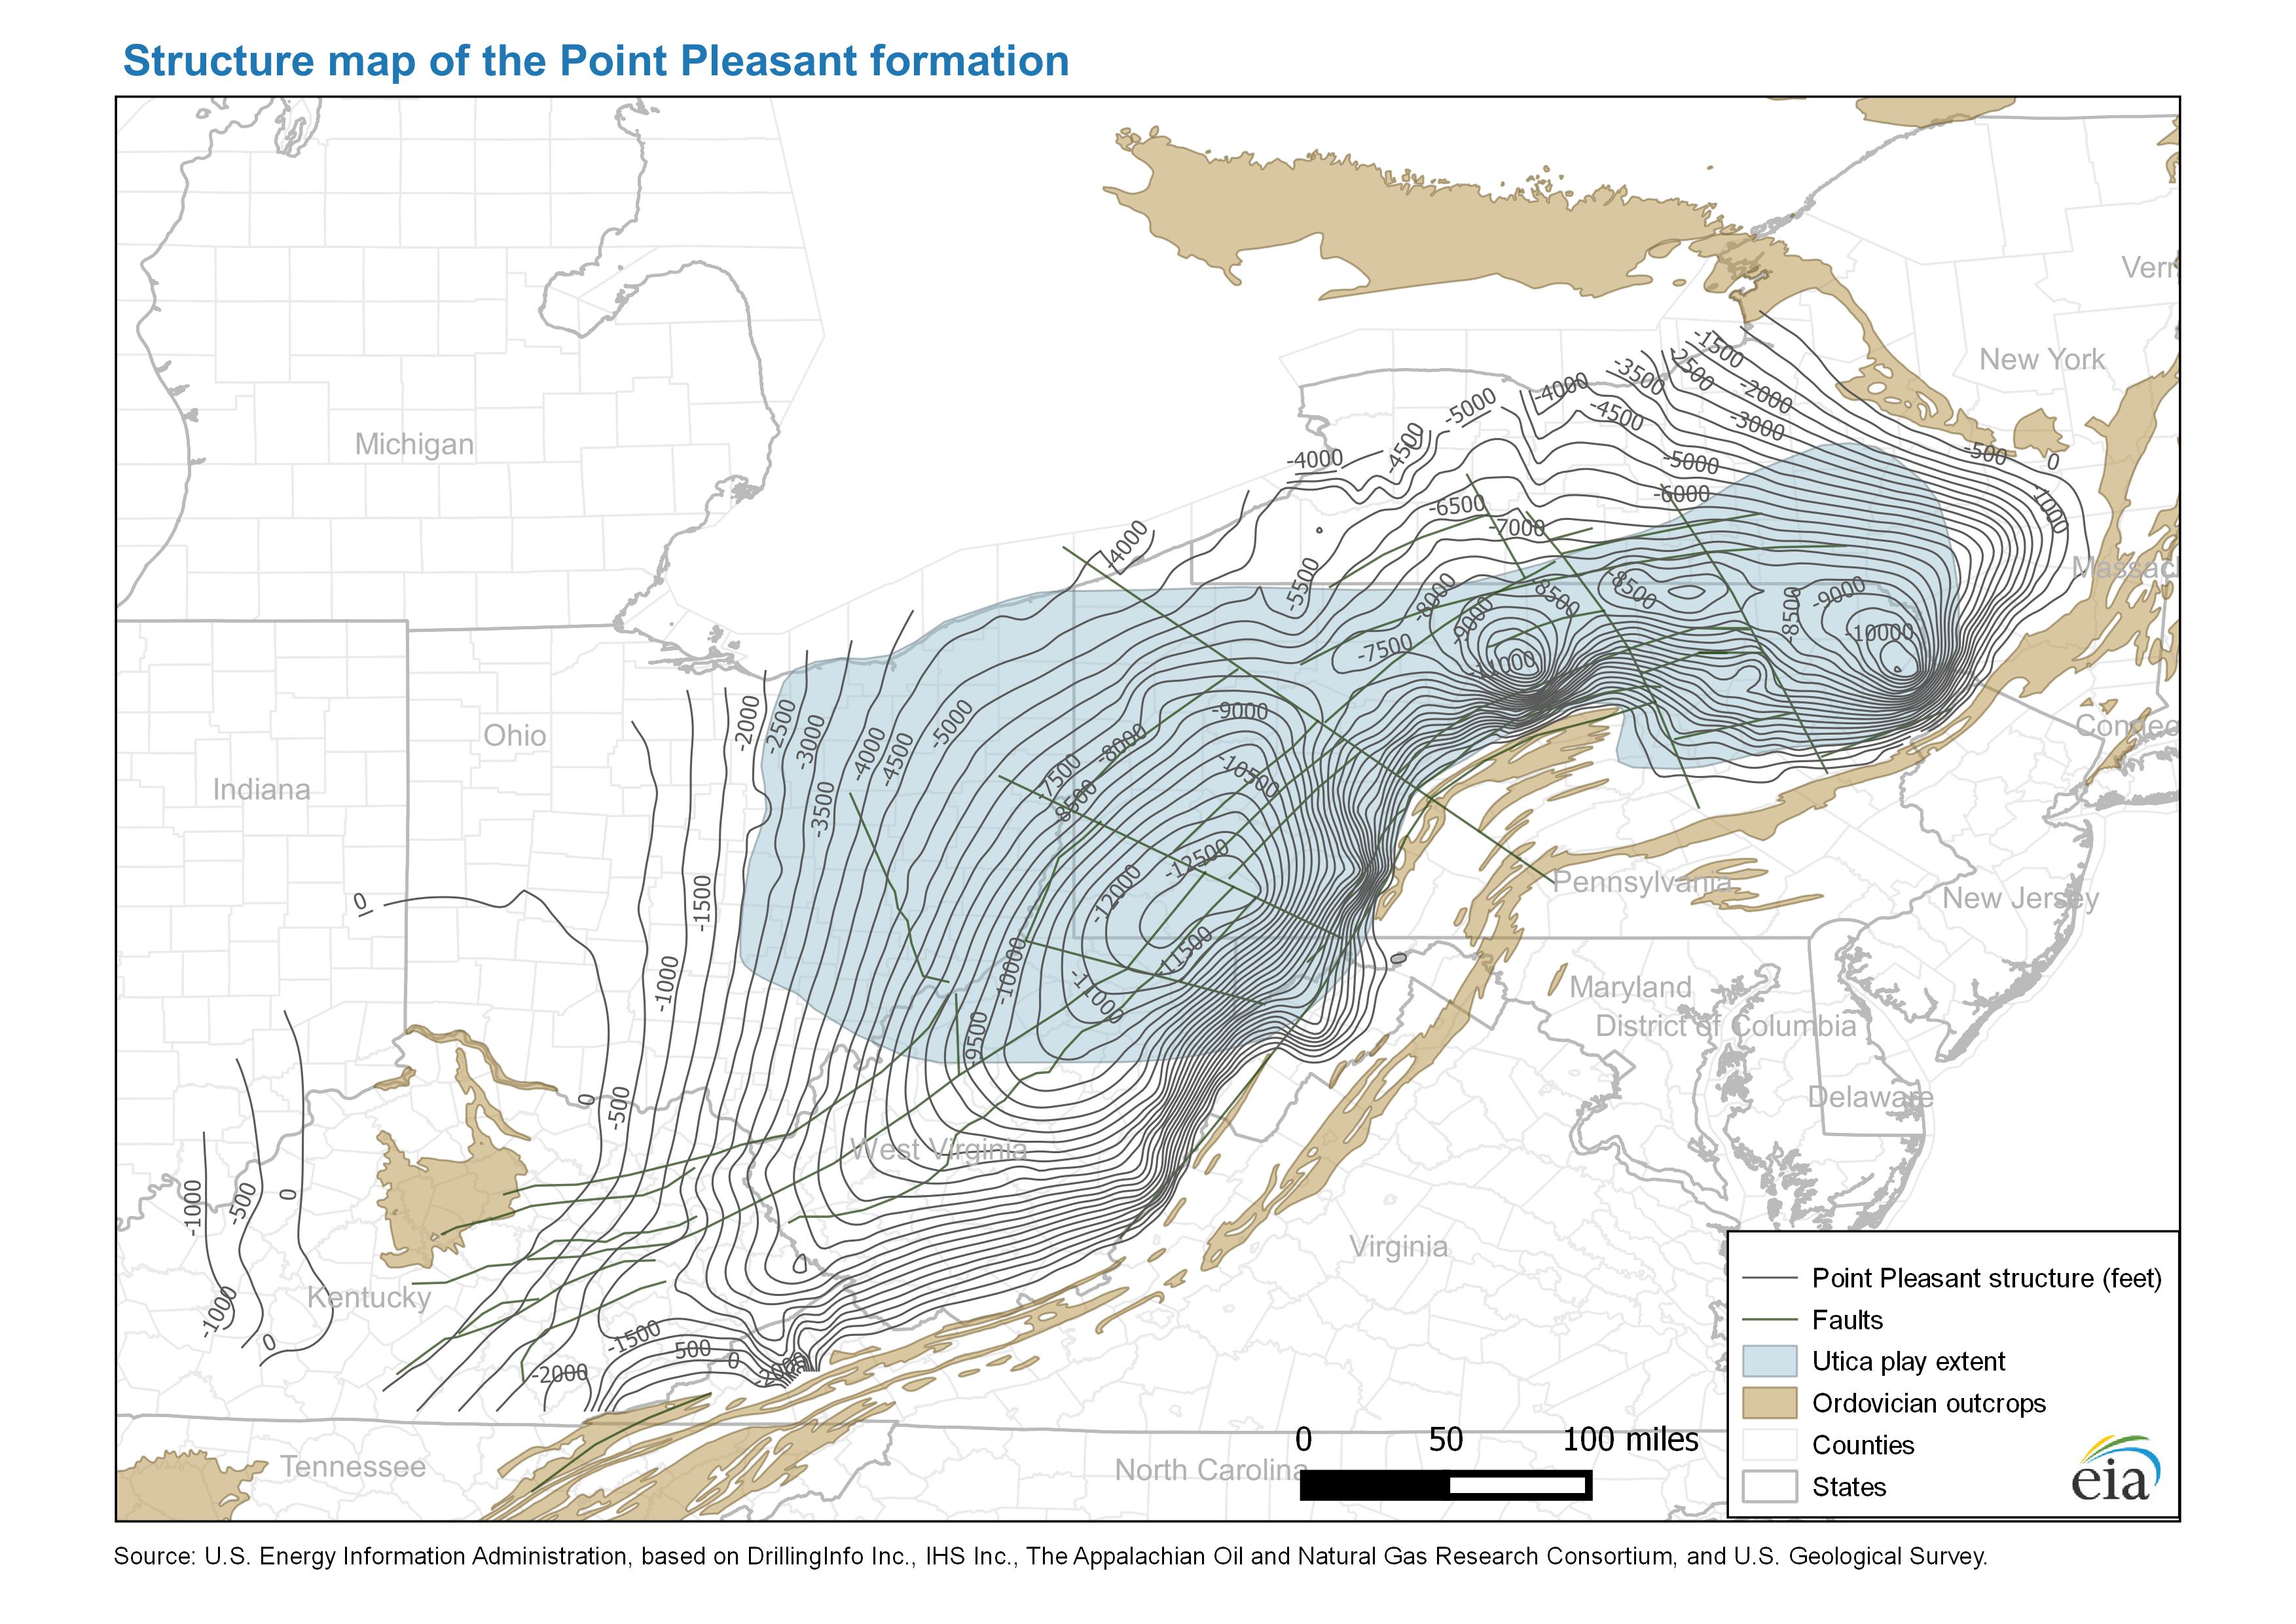
The Utica is a stacked play that includes both the Utica formation and the underlying Point Pleasant formation. Currently, the deeper Point Pleasant is more often targeted for oil and natural gas drilling because it is more productive. Most of the more productive areas across the Point Pleasant formation footprint are in eastern Ohio and western Pennsylvania. Subsea elevation contour maps representing the top surface of each formation were developed with depth measurements from wells and outcrop data from the U.S. Geological Survey. These maps represent subsea depths and only roughly approximate drilling depth to reach the top of each formation.
The Point Pleasant formation is deepest in the southwest region of Pennsylvania, reaching subsea depths of more than 13,000 feet, and it is shallowest at the junction of Ohio, Indiana, and Kentucky. The Utica formation reaches subsea depths of up to 12,500 feet in a northeast arc though Pennsylvania and is also shallowest at the junction of Ohio, Indiana, and Kentucky. The most productive wells in the Utica formation are found at subsea depths ranging from 5,000 to 11,000 feet.
Structure maps not only provide valuable drilling information, but they also lend insight into the distribution of oil and natural gas throughout the play. Temperature and pressure, which are functions of a formation's depth, are key factors in the amount of oil and natural gas present in the formation.
Source: U.S. Energy Information Administration, based on DrillingInfo, Inc., IHS Inc., the Appalachian Oil and Natural Research Consortium, and U.S. Geological Survey
Note: Click to enlarge.
Source: U.S. Energy Information Administration, based on DrillingInfo, Inc., IHS Inc., the Appalachian Oil and Natural Research Consortium, and U.S. Geological Survey
Note: Click to enlarge.
Source: U.S. Energy Information Administration, based on DrillingInfo, Inc., IHS Inc., the Appalachian Oil and Natural Research Consortium, and U.S. Geological Survey
Note: Click to enlarge.
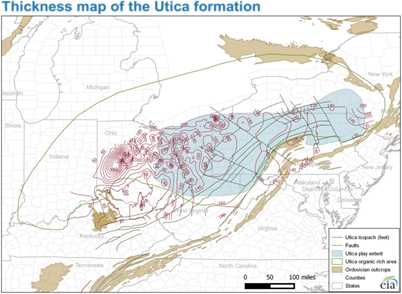
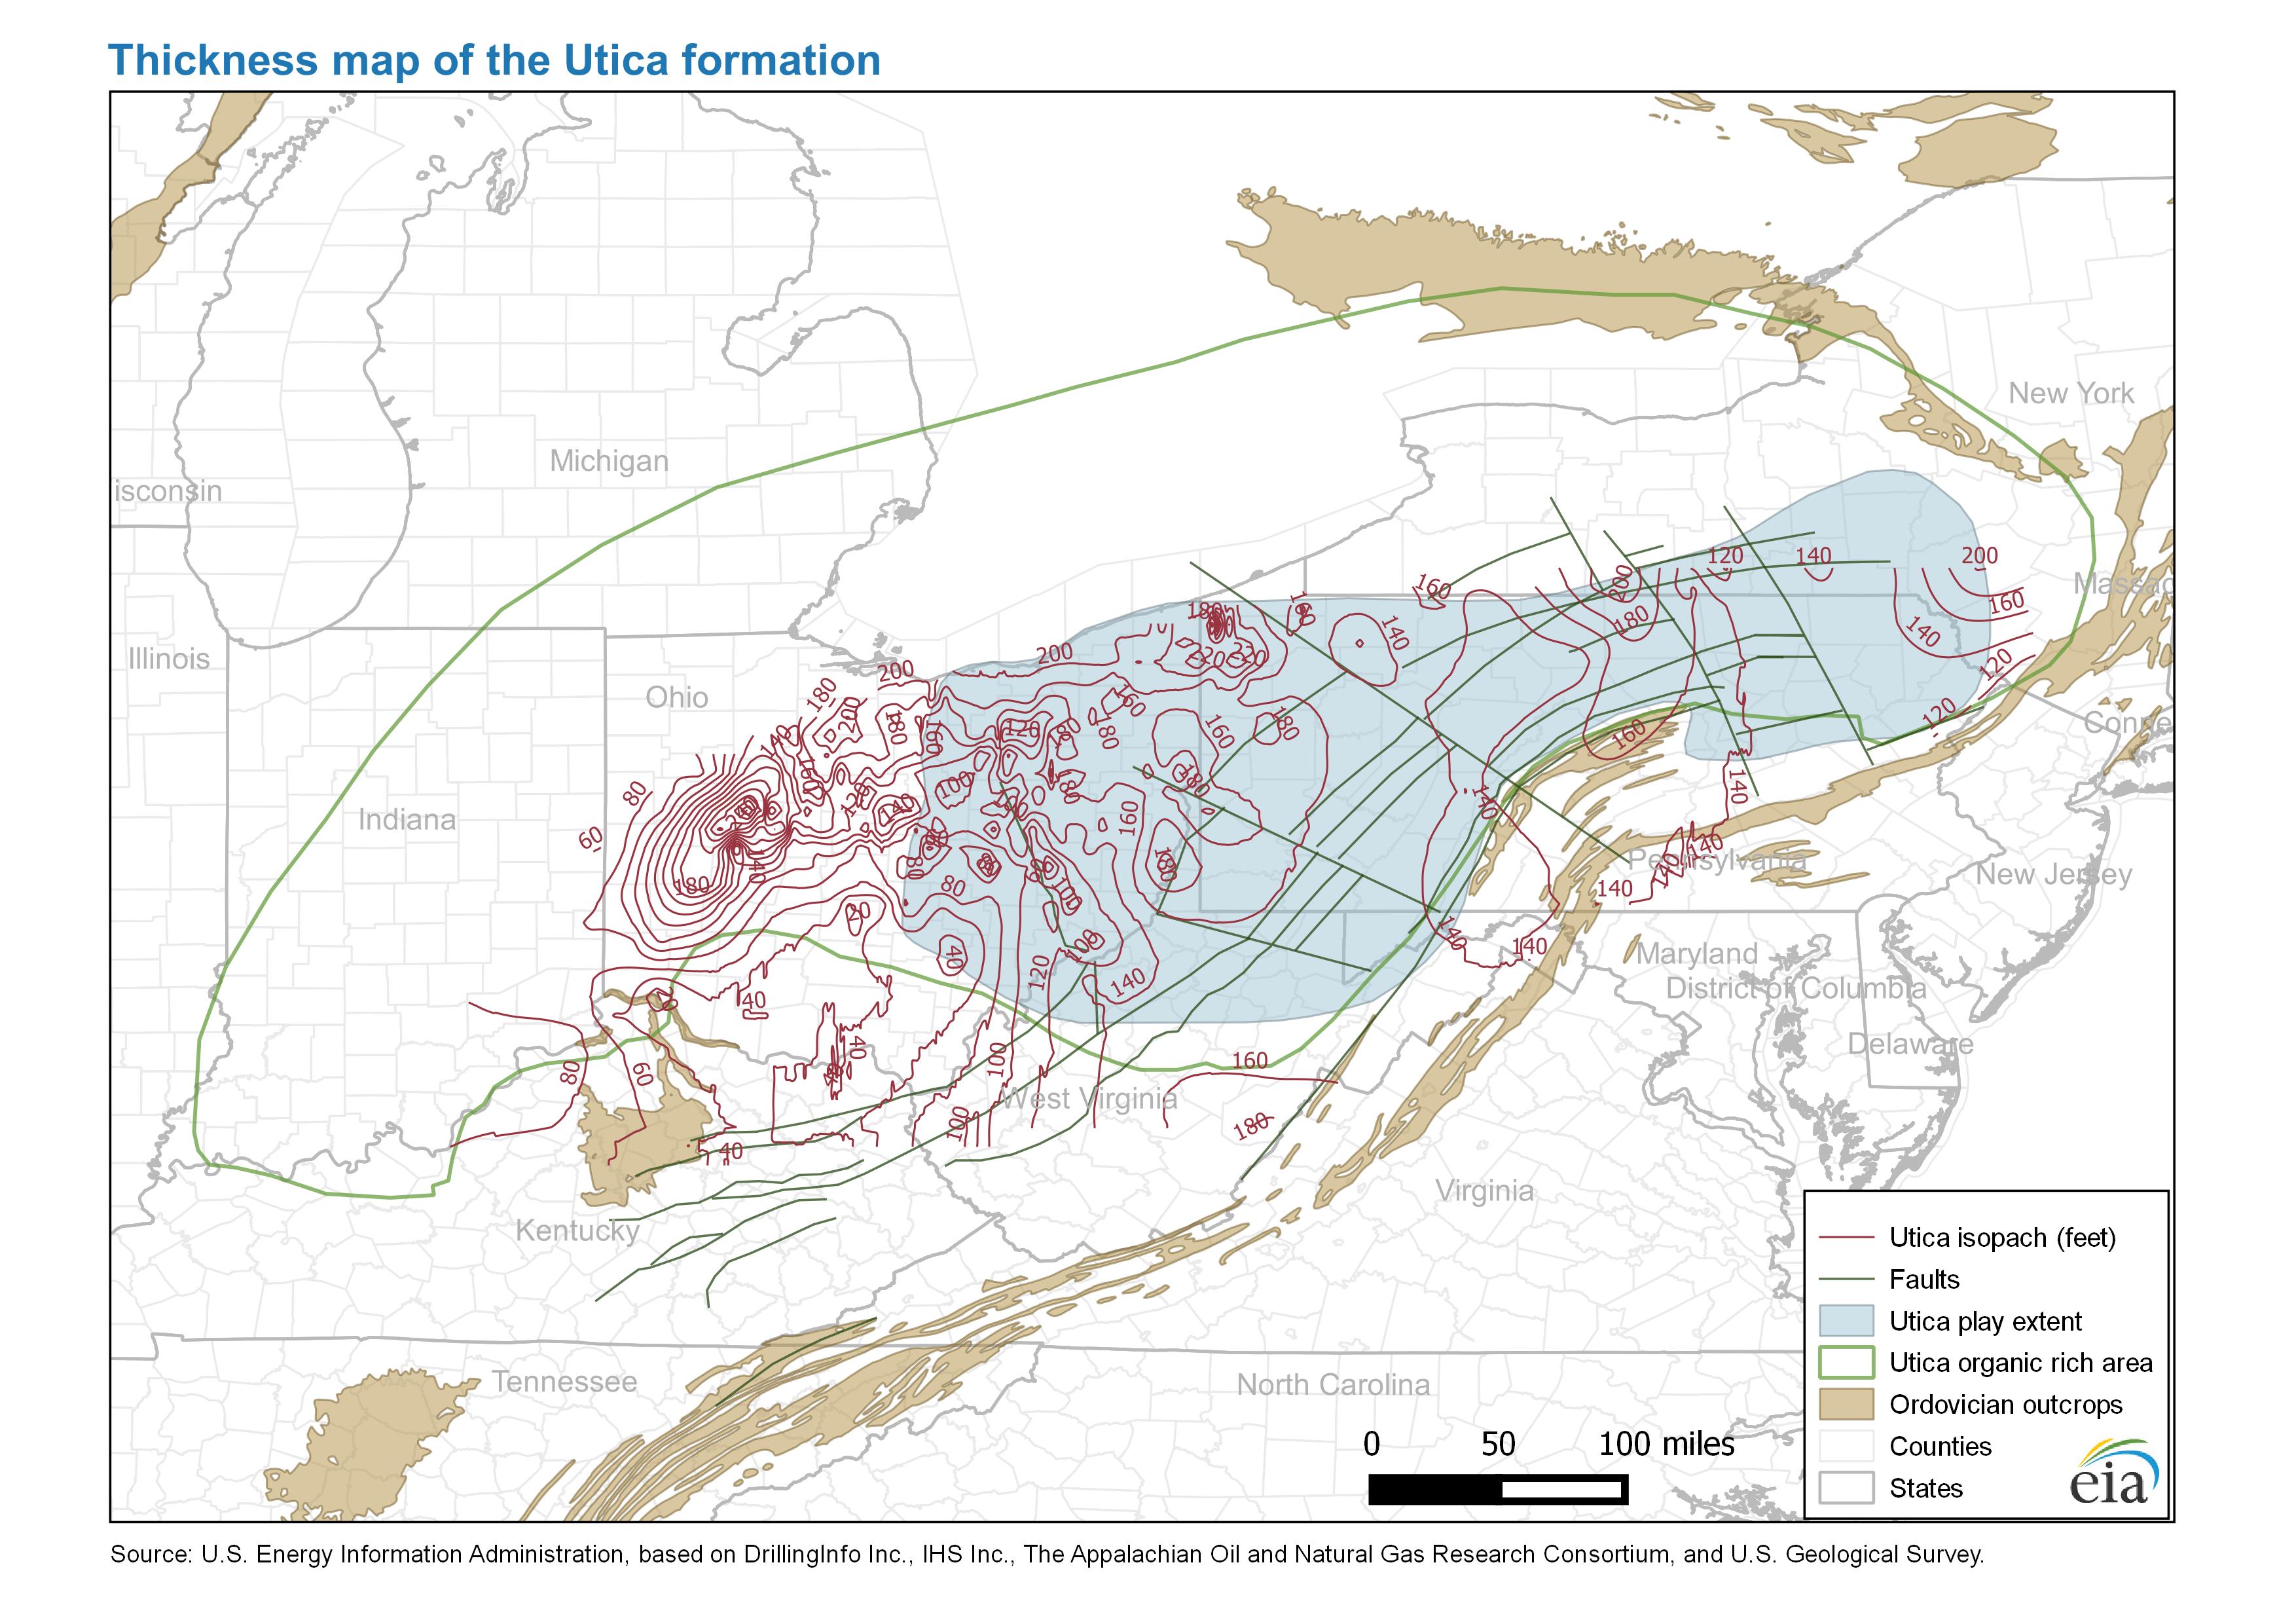
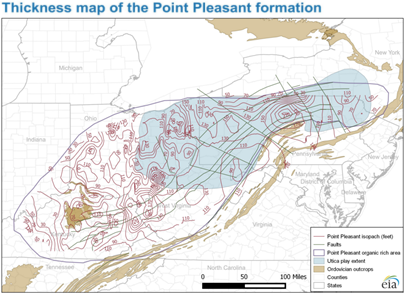
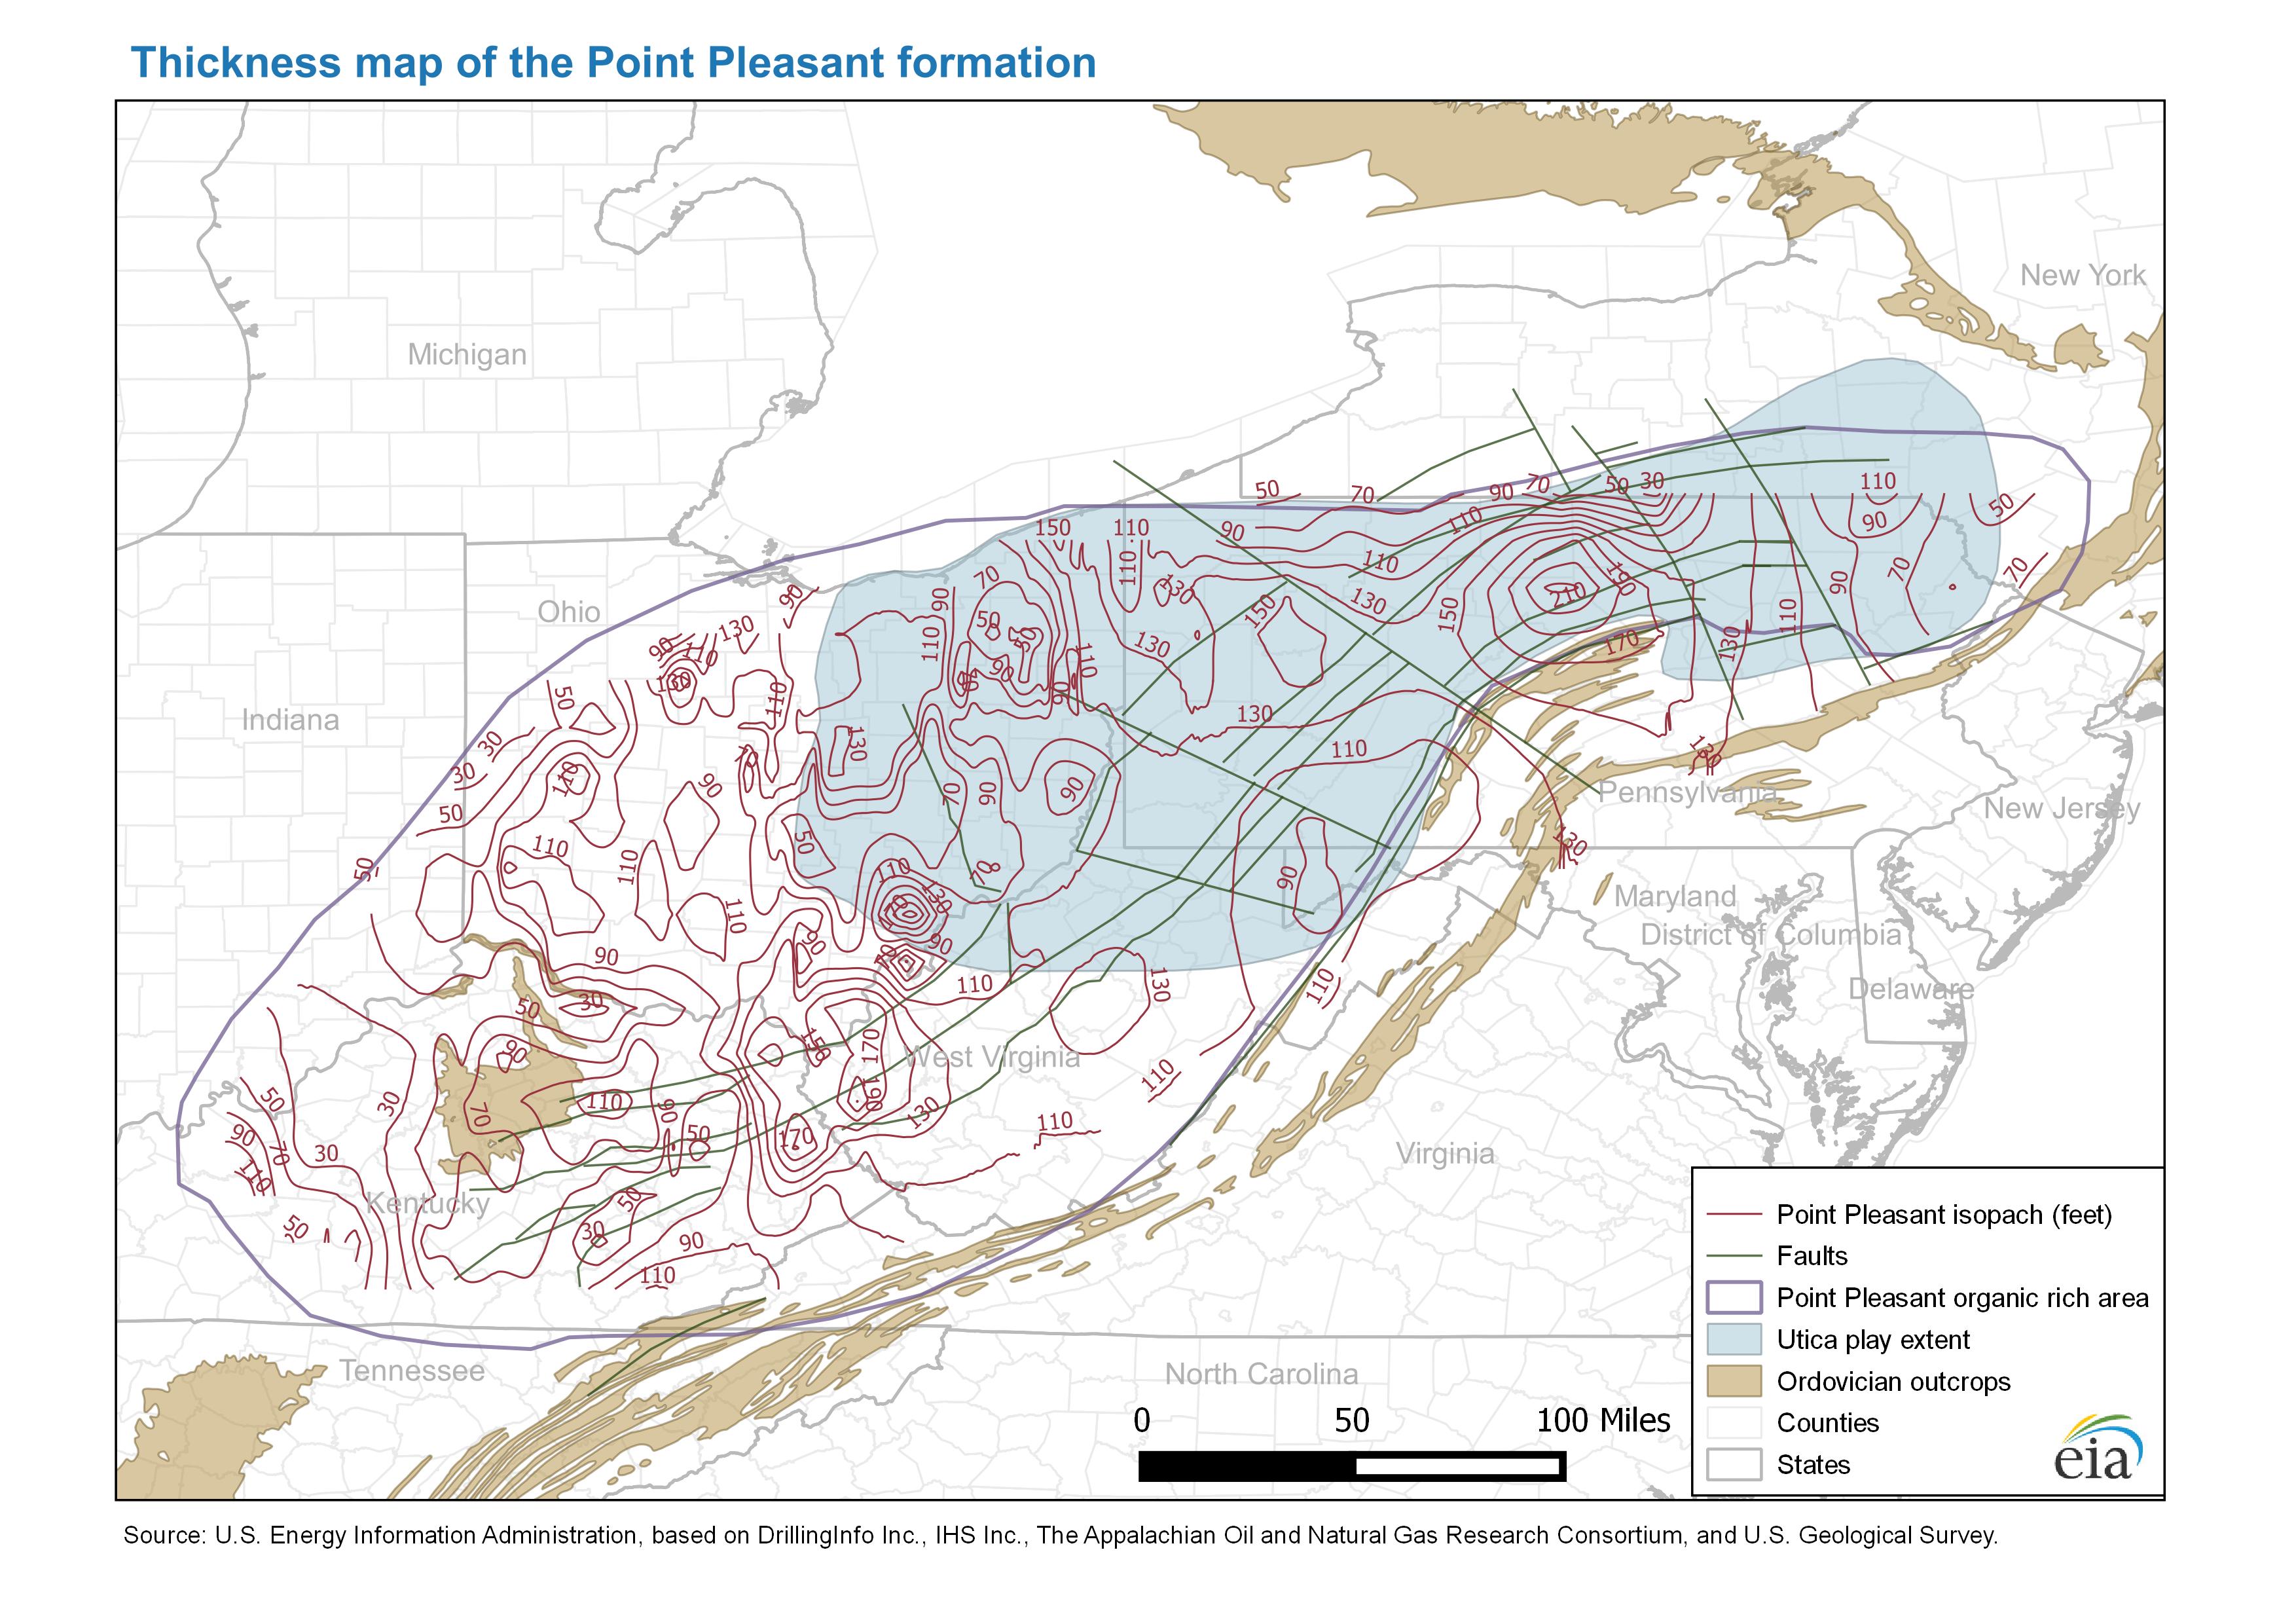
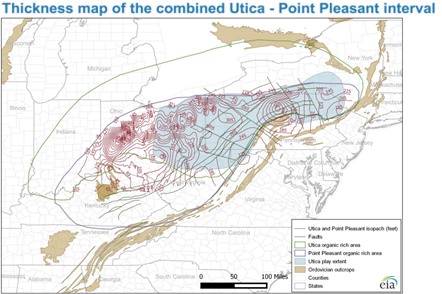
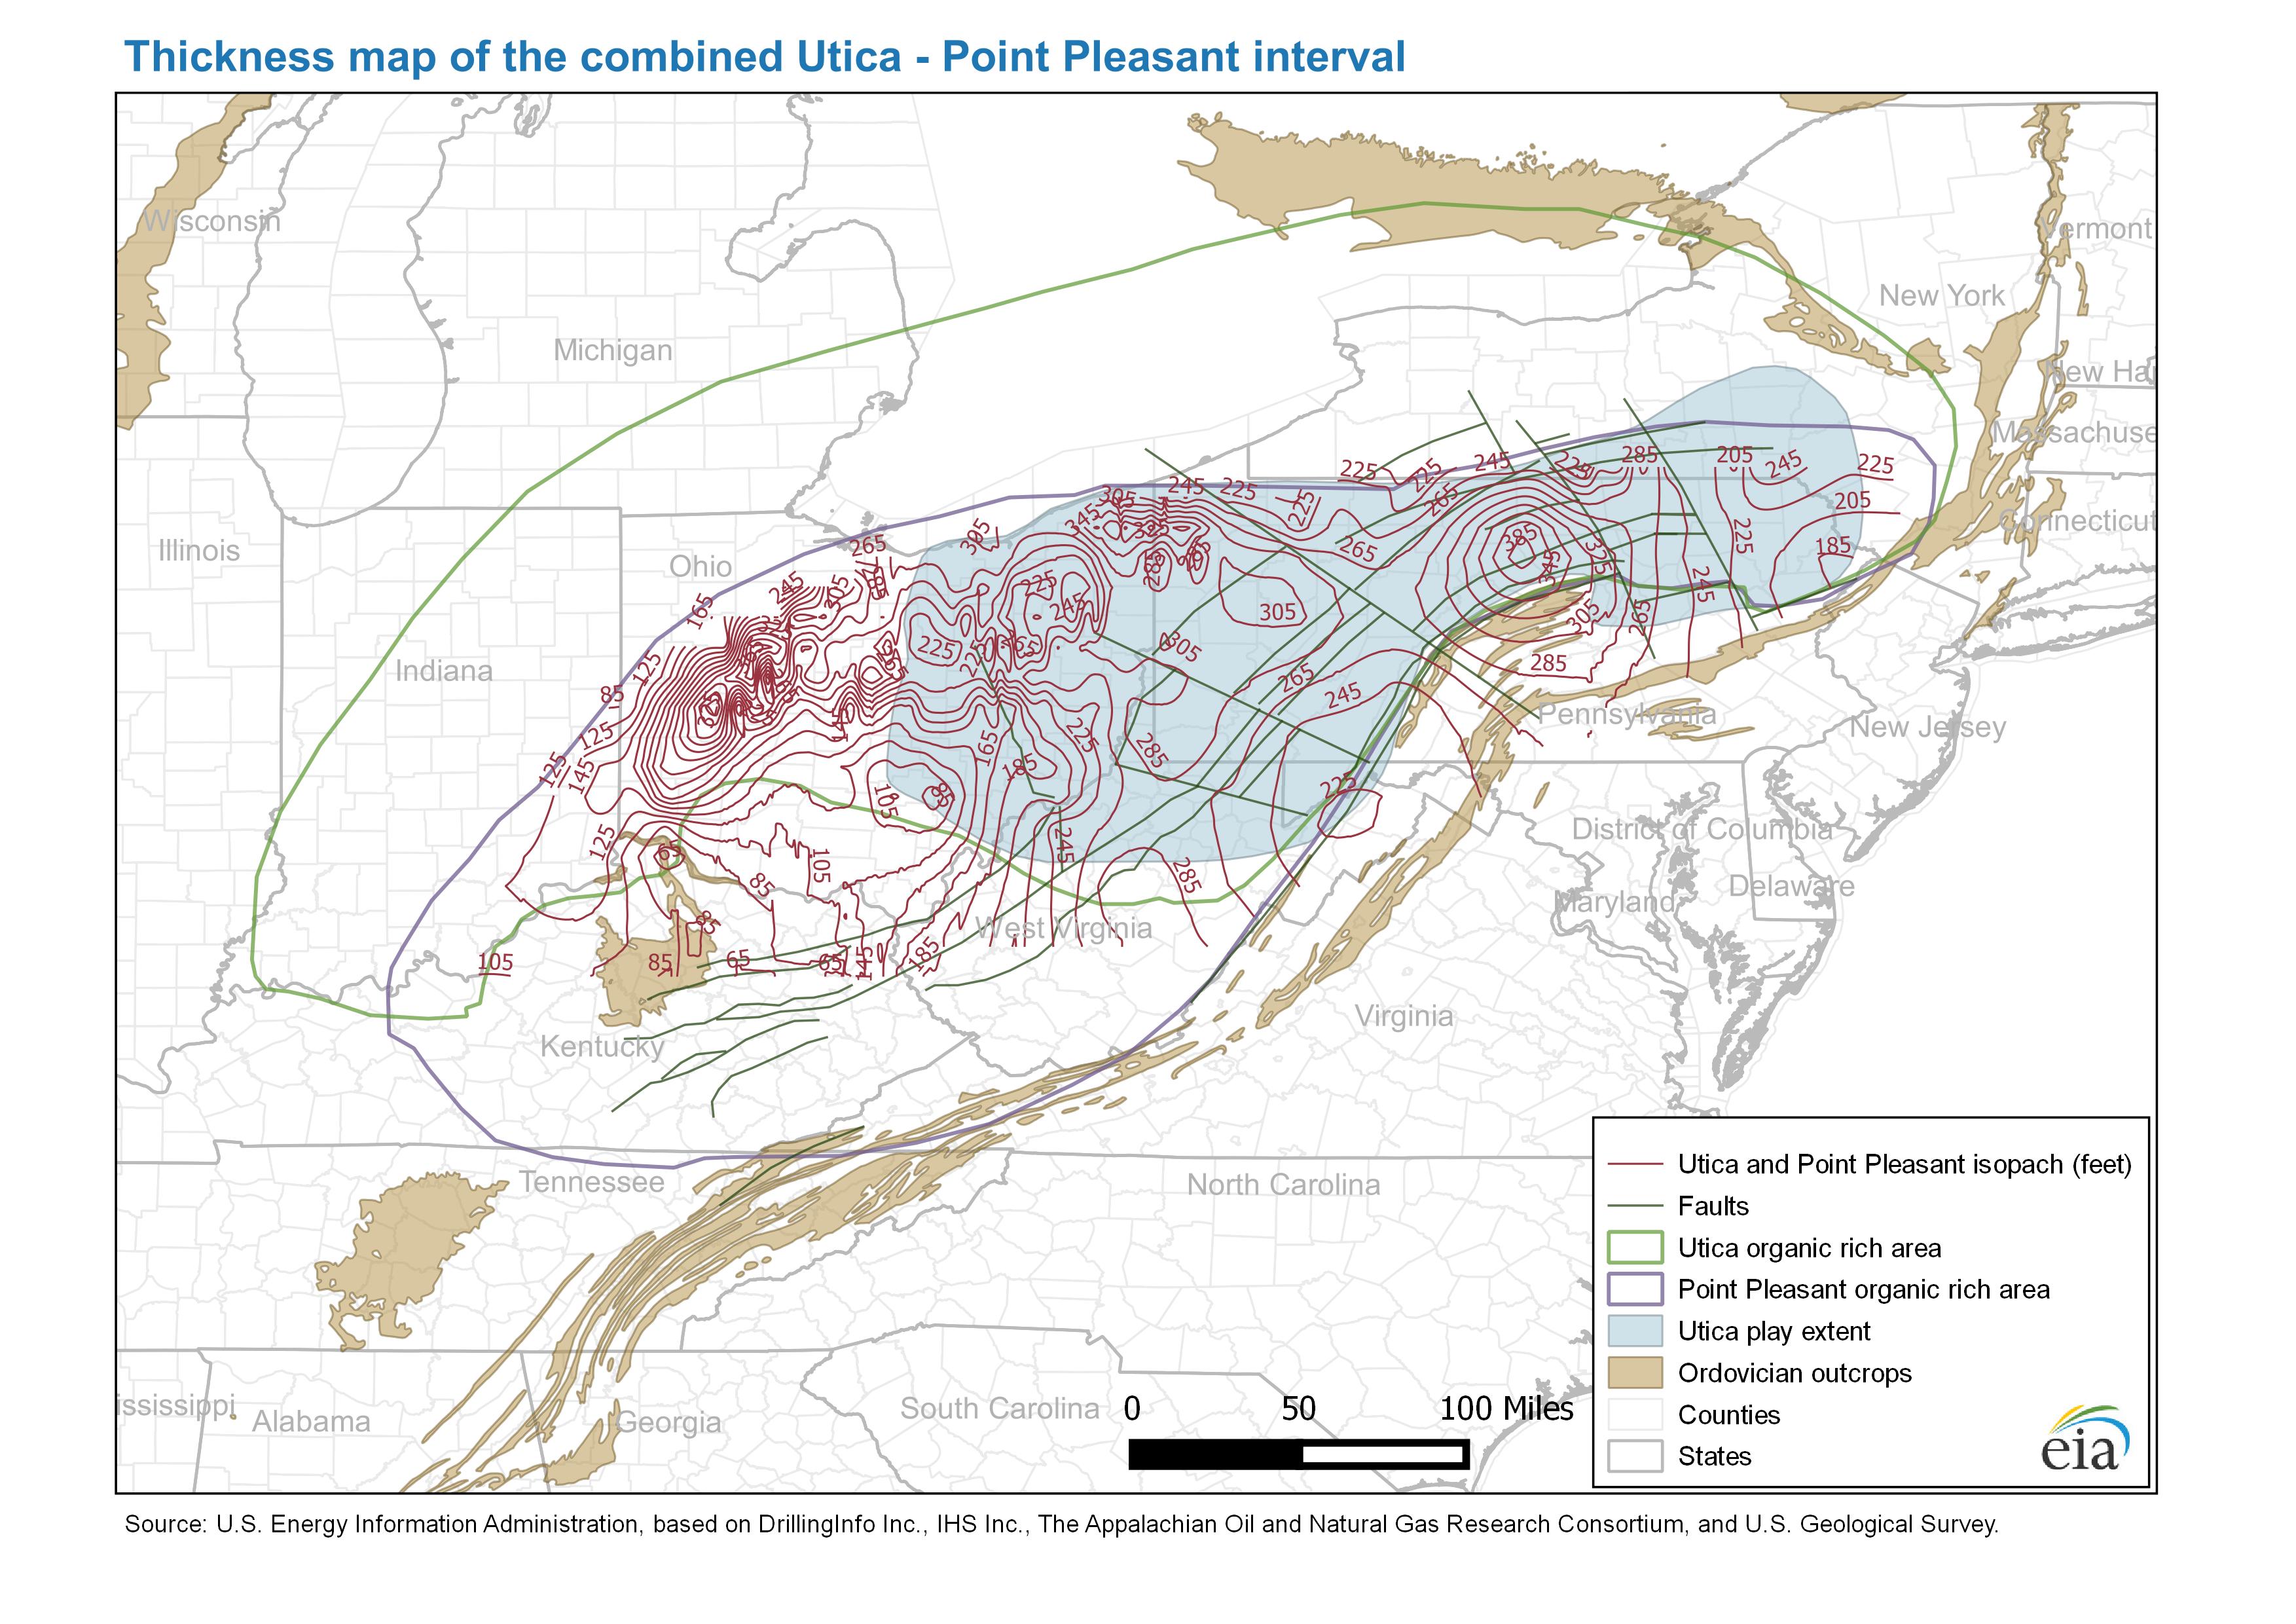
Thickness maps (isopach) for each formation individually and for the Utica play as a whole were developed using observations from wells. The maps also show areas of high organic content, which is a factor in the amount of hydrocarbons in the rock. Like structure maps, isopach maps provide valuable drilling information because thickness of the reservoir is a key factor in determining whether, and where, to drill a well.
The Utica formation is thickest in western Ohio and the northwest corner of Pennsylvania at 200-300 feet and thins to 50 feet or less in southern Ohio and northern Kentucky. The Point Pleasant formation reaches a thickness of more than 200 feet in central Pennsylvania and thins to less than 20 feet in the eastern half of Kentucky. The combined thickness of Utica and Point Pleasant is less than 100 feet in the area where Ohio, West Virginia, and Kentucky meet. The thickness reaches more than 300 feet in northwest and central Pennsylvania, and in northeast and central Ohio. Most producing wells are located where the formation has a thickness of 150 feet or more.
Principal contributors: Olga Popova, Tess Haegele, Gary Long
Tags: liquid fuels, map, natural gas, Ohio, oil/petroleum, Pennsylvania, production/supply, states, Utica, West Virginia