U.S. commercial nuclear capacity comes from reactors built primarily between 1970 and 1990
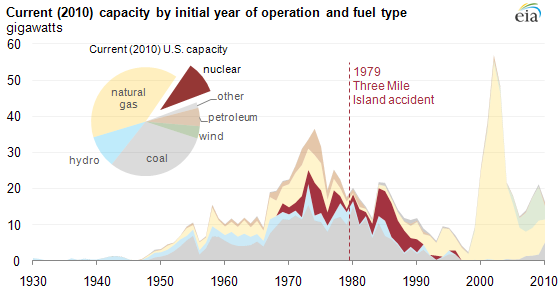
Note: Data for 2010 are preliminary. Generators with online dates earlier than 1930 are predominantly hydroelectric. Data include non-retired plants existing as of year-end 2010. This chart shows the most recent (summer) capacity data for each generator. However, this number may change over time, if a generator undergoes an uprate or derate.
Download CSV Data
The June 16 edition of Today in Energy examined the wide age range of electric power generators for all fuels; today's article looks specifically at nuclear generators.
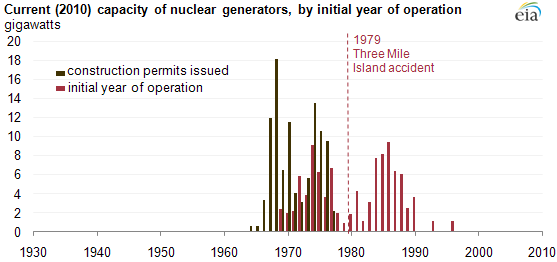
Nuclear power plants in the United States were primarily built between 1970 and 1990. Plans for nuclear capacity additions slowed dramatically in the late 1970s reflecting decreasing growth rate in electric power demand1, higher nuclear construction costs, higher investment risk from licensing challenges, higher cost of capital, and design changes resulting from the Three Mile Island accident in 1979. However, given the length of the construction and permitting processes, considerable amounts of nuclear capacity committed to at an earlier date continued to come online through the early 1990s. The average construction time increased from 7 years for plants with construction licenses issued between 1965 and 1970 to 11 years for licenses issued between 1973 and 1977. Construction costs for nuclear power plants also escalated sharply2.
Download CSV Data
There are 104 nuclear units currently operating in the United States, ranging in capacity from 478 to 1317 megawatts electric (MWe), and averaging 971 MWe in capacity. This is quite large for a single electric power generator. Planned outages for maintenance and refueling at nuclear power plants are carefully coordinated. As nuclear power plants provide baseload power, they operate at very high capacity factors (from 2000-2009, the average nuclear capacity factor was 90%). Nuclear units, while representing only 10% of the Nation's generating capacity (over 101,000 MWe), supplied 20% of the electricity generation for the U.S. in 2010.
The U.S. nuclear capacity can change in three main ways:
- Decomissioning (retirements). A total of 19 U.S. commercial reactors have been shut down to date.
- New additions. There are a few reactors in various stages of permitting, planning, and construction, though new builds can take a significant amount of time to complete. The Energy Policy Act of 2005 authorized the Department of Energy to issue loan guarantees for new nuclear power projects. The last new reactor to enter commercial service was the Tennessee Valley Authority's (TVA) Watts Bar 1 in Tennessee in 1996.
- Uprates. Nuclear capacity uprates can be significant. To date, the Nuclear Regulatory Commission (NRC) has approved nearly 6000 MWe of uprates.
Additionally, nuclear reactors are licensed for an initial operating life of 40 years by the NRC. Their original operating license can be extended, subject to NRC review and approval. As of December 2010, nearly 60% of operating reactors have received 20-year life extensions. A 2010 survey by the Electric Power Research Institute indicated the intention by many nuclear plant operators to apply for plant life extensions to operate the plants up to 80 years from the date of commissioning.
To learn where nuclear plants are located in the United States, see the State Nuclear Profiles.
Footnotes:
1 The demand for electricity grew an average of 7.3% per year in the 1960s, 4.7% in the 1970s and 2.9% in the 1980s.
2 For example, take two comparable reactors, Oconee 3 and Catawba 2. Both were built by Duke Energy in the same region of the country, with the same reactor type. Construction costs for Oconee 3 (built in1974) were $0.2 million/MWe. Catawba 2 came online twelve years later in 1986, and cost $1.4 million/MWe (mixed-current dollars).
Tags: capacity, electricity, nuclear, policy