Oil and natural gas import reliance of major economies projected to change rapidly
Note: Import reliance is expressed as (imports-exports)/consumption for the United States and (consumption-production)/consumption for other countries and regions as we do not project gross import/export values in the IEO. While this analysis focuses on the mid-term 2020 timeframe, IEO projections extend to 2040. Chart recreated based on a Bloomberg New Energy Finance graphic using International Energy Agency data.
Republished September 9, 2014, updated to include OPEC Africa oil production.
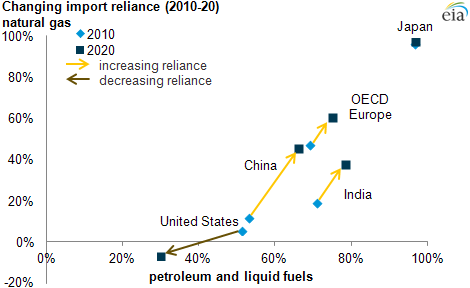
The 2014 Annual Energy Outlook projects declines in U.S. oil and natural gas imports as a result of increasing domestic production from tight oil and shale plays. U.S. liquid fuels net imports as a share of consumption is projected to decline from a high of 60% in 2005, and about 40% in 2012, to about 25% by 2016. The United States is also projected to become a net exporter of natural gas by 2018.
Conversely, other major economies are likely to become increasingly reliant on imported liquid fuels and natural gas. China, India, and OECD Europe will each import at least 65% of their oil and 35% of their natural gas by 2020—becoming more like Japan, which relies on imports for more than 95% of its oil and gas consumption.
The reasons for these shifts are different between emerging and developed economies. In China and India, oil demand growth from emergent middle classes will likely outpace domestic production, while OECD Europe will likely become more import reliant as a result of declining oil production in the North Sea.
Here are reasons why EIA is projecting increasing import reliance in many countries, from the 2013 International Energy Outlook (IEO) report:
China. As noted in the 2013 IEO, China will experience the largest absolute growth in liquid fuels consumption, growing by about 46% by 2020 and doubling by 2040 from 2010 levels, as it moves from an industrial manufacturing economy to a more service-oriented economy with greater automobile saturation. China will also experience the largest growth in natural gas demand because the government is promoting gas as a preferred fuel to help alleviate air pollution. From 2010 to 2020, EIA projects natural gas consumption to rise at an average rate of 7.5% per year, while production will grow by an average of 2.4% per year, with growing shares from coalbed methane and shale gas coming on line by 2020.
India. EIA expects India to have the fastest growth rate in liquid fuels consumption from 2010 to 2020 (3.0% per year) and the second-largest absolute growth (behind China), primarily driven by diesel fuels used in transportation, irrigation, manufacturing, and electricity generation. EIA projects India's natural gas consumption to grow on average by 1.5% annually from 2010 to 2020, while production decreases by an average of 1.1% per year during that time period.
OECD Europe. EIA expects demand for oil products in OECD Europe to plateau as most countries will see their population remain flat. Oil output from the North Sea, the largest source of European production and the location of the Brent International price benchmark, reached its peak production level in 1996, and EIA expects an average annual decline of 2.9% from 2010 to 2020. EIA projects overall natural gas production to decline about 2.6% annually from 2010 to 2020 before returning to 2010 levels in 2040. European natural gas consumption will grow at a modest 0.3% per year from 2010 to 2020.
While the discussion above focuses on economies that are net importers of both oil and natural gas, many economies are net exporters of one or both of these fuels, as shown in the quadrant diagram below. Economies in the Middle East (most of which are members of the Organization of the Petroleum Exporting Countries), Russia, Africa, and Canada are net exporters of both oil and natural gas (bottom left in graph). The Middle East, Russia, and Africa all export more than 2.4 times their domestic oil consumption.
Less common are countries that are net importers of one fuel and net exports of the other. OECD Latin America (top left, consisting of Mexico and Chile) is an overall oil exporter but relies on imported natural gas (primarily from U.S. pipelines to Mexico). Brazil will also join this group in the near future when it ramps up production in its offshore oil fields. Finally, Australia/New Zealand (bottom right) consume more oil than they produce but export natural gas. Australia's natural gas export market is projected to increase markedly as planned LNG export terminals come on line.
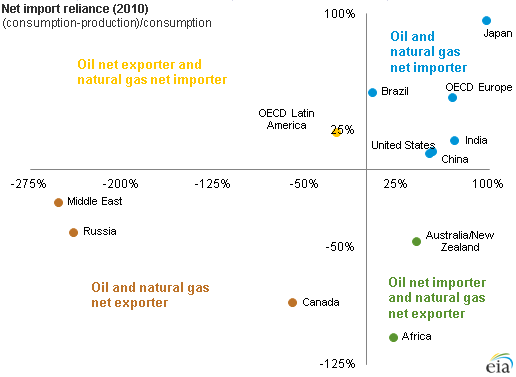
Note: Import reliance is expressed as (consumption-production)/consumption. While a country can only import up to 100% of consumption, there is no limit to the extent exports can exceed consumption.
Principal contributors: Robert McManmon, Mark Eshbaugh
Tags: China, Europe, exports/imports, India, international, liquid fuels, natural gas, OECD, oil/petroleum