Trends in natural gas storage capacity utilization vary by region
Republished September 4, 2013, 11:00 a.m. to correct an error in the graph's note.
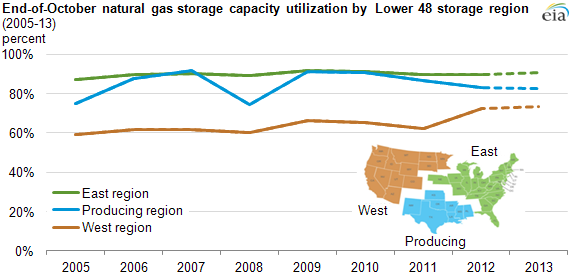
Note: Dashed lines indicate projections. Utilization rate reflects each region's working natural gas inventories as of October 31 as a percentage of its working gas storage capacity. Working gas storage capacity equals the difference between total natural gas capacity and base gas inventories, or gas stored to maintain adequate reservoir pressures. Total gas inventories prior to 2012 calculated using the Natural Gas Annual data. Monthly data used for 2012, based on storage levels as of December 31, 2012. Estimates of storage facility utilization on October 31, 2013 are based on projected working gas inventories divided by working gas storage capacity as of June 30, 2013. Alaska is backed out of the West region projection, with the assumption that its monthly inventories grow through October 2013 at the same rate as for the West region as a whole.
Underground natural gas storage fields in the American Gas Association's (AGA) East region have neared their capacity limits before each winter since 2005. Storage field utilization in the East has ranged between 87% to 92% before November of each year despite changes to market conditions. However, storage capacity utilization varies by region because of differences in weather patterns, types of facilities, pipeline constraints, proximity to supplies, and regulations.
Storage levels and available capacity for working natural gas, or natural gas that is used for withdrawal, respond to a different set of factors in each region:
- East region. For many states in this region, local distribution companies are legally required to purchase and store working gas to ensure sufficient inventories to meet increased winter demand. As a result, working gas storage capacity generally tends to be full in the East by the end of October, regardless of weather and market conditions. The region consistently uses close to or above 90% of its working gas storage capacity by the end of October.
- Producing region. End-of-October capacity utilization levels vary more in this region, mainly because of the prevalence of salt cavern facilities. As of December 2012, salt caverns accounted for 407 billion cubic feet (Bcf), or 27%, of the 1,522 Bcf total working gas design storage capacity in the Producing region. These facilities operate under high pressure, facilitating quick turnaround for injections and withdrawals. This enables market participants in the region to more immediately respond to short-term price fluctuations. Injections and withdrawals thus follow a more flexible schedule, causing end-of-season storage levels to vary. In the past five years, working gas storage levels at the end of October have varied from roughly 74% of available storage capacity (2008) to 92% of capacity (2009).
- West region. As in the East region, storage operators in the West use their facilities to ensure that inventories are sufficient to meet increased demand during the winter months. Also, both interstate and intrastate natural gas pipelines use Western storage facilities to support load balancing. Storage levels are relatively stable and generally lower than in the East and Producing regions, due largely to unused capacity in depleted wells in areas such as the Williston Basin that do not have easy access to areas of high demand, although they have increased in recent years. Since 2005, end-of-October working gas storage capacity utilization has been between 59% and 72%.
The Producing region differs from the East and West regions in that its salt cavern storage facilities require lower volumes of base gas, which is natural gas required to maintain adequate pressure in the facilities. Since the beginning of 2012, base gas has accounted for about 41% of total storage capacity in the Producing region, versus 53% in the East region and 46% in the West region. This difference in the base gas required means that a relatively greater portion of storage capacity in the Producing region can be set aside for working gas. Changes in the Producing region's pre-winter working gas inventories have driven changes to overall inventories in the Lower 48 states.
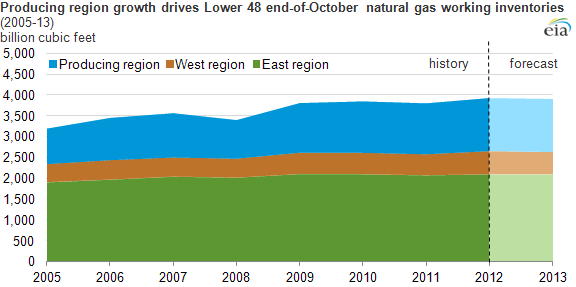
Note: Storage reflects each region's working natural gas inventories as of October 31. Alaska is backed out of the West region projection, with the assumption that its monthly inventories grow through October 2013 at the same rate as for the West region as a whole.
The Short-Term Energy Outlook projects that U.S. working inventories will reach 3,800 Bcf by the end of October 2013, with April-October injections similar to those in 2008–11, but much higher than in 2012, when October 31 inventories reached a record 3,930 Bcf. Projected inventory levels for October 31, 2013 are lower than those for the same date in 2012 because of increased withdrawals in the Producing region during a colder 2012–13 winter, along with flattening production in 2013.