Consumption
Between 2009 and 2010, renewable energy consumption rose by 6 percent to over 8 quadrillion Btu (Figure 1). At the same time, total U.S. energy consumption rebounded by 4 percent to nearly 98 quadrillion Btu, due in some measure to economic recovery (Table 1).
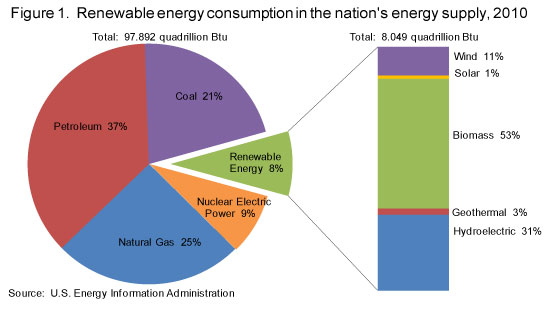
Renewable energy's share of U.S. consumption in 2010 was up slightly to a little more than 8 percent. The main drivers behind the changes in renewable energy were consumption increases of 288 trillion Btu for biofuels and 203 trillion Btu for wind. These were partially offset by a decrease of 160 trillion Btu for conventional hydroelectric power.
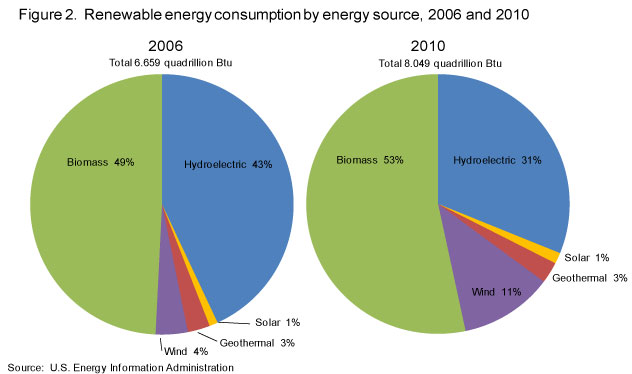
Between 2006 and 2010, the biomass share of renewable consumption increased from 49 to 53 percent, wind increased from 4 to 11 percent, and conventional hydroelectric decreased from 43 to 31 percent (Figure 2). Geothermal's share stayed steady at 3 percent of renewable energy, but consumption rose from 181 trillion Btu to 212 trillion Btu. Likewise, solar's share remained steady at 1 percent, despite growing rapidly at an average annual rate of 12 percent.
Between 2006 and 2010, ethanol consumption more than doubled to over 1 quadrillion Btu (Table 2). It is expected to grow further in the future, due in some measure to the changing regulatory environment. Near the end of 2010, the Environmental Protection Agency (EPA) issued the final volume of renewable fuels required in 2011 under the Clean Air Act Section 211(o), as amended by the Energy Independence and Security Act of 2007 (EISA).1 The target is 13.95 billion ethanol equivalent gallons of renewable fuels, including corn ethanol, cellulosic biofuels, biomass-based diesel, and advanced biofuels. By comparison ethanol consumption with denaturant stood at 13.19 billion gallons for 2010.2
Also, to relieve constraints in the consumer ethanol market known as the 10 percent blend wall, EPA approved, as a first step, waivers to permit a blend of motor gasoline with 15 percent ethanol (E15) to be sold for use in light-duty vehicles model year 2001 and later. A blend of motor gasoline and 85 percent ethanol (E85) is another potential market for ethanol, but further expansion depends on a much greater number of E85 vehicles being made available and the expansion of infrastructure to deliver the fuel. Until the U.S. vehicle fleet is able to absorb substantially more ethanol, exports are expected to increase and imports will decline.
The consumption of biodiesel, the other main biofuel, dropped 30 percent in 2010 as domestic production plummeted due to the expiration of the biodiesel blender tax credit at the end 2009 and a further decline in imports. Late in December 2010, the credit was extended retroactively for 2010 and forward through 2011, so production and consumption may pick up temporarily, though there are issues about how the industry may respond to the uncertainties of a one-year renewal.
The electric power sector had the most renewable energy consumption, a little over 4,000 trillion Btu, but its market share decreased from 55 to 50 percent between 2006 and 2010 (Table 2). The industrial sector was second with 2,249 trillion Btu and a steady market share. The transportation sector's consumption more than doubled from 475 trillion Btu in 2006 to 1,098 trillion Btu in 2010, due to the expanded consumption of biofuels. As a result, the sector's share of renewable energy doubled from 7 to 14 percent. The residential and commercial sectors were the smallest sectors with stable market shares.
Electricity
Renewable energy provided 10 percent, or 425 billion kilowatthours (kWh) of electricity in 2010, out of a U.S. total of 4,120 billion kWh (Table 3).3 U.S. total net generation increased by 4 percent, while renewable generation increased just 2 percent between 2009 and 2010. Renewable generation would have been higher, but for a net decrease of 16 billion kWh in conventional hydropower due to low water availability. Thirty-seven states experienced losses in hydropower generation (Table 5 and Table 6). Washington and Oregon in the West and Alabama, New York and Tennessee in the East had the largest decreases. California was a notable exception, experiencing an increase of 6 billion kWh in hydropower generation. Over half of total renewable generation was provided by 5 states (California, New York, Oregon, Texas and Washington).
Wind generation increased by 21 billion kWh to 95 billion kilowatt hours, as it experienced across-the-board increases in 34 states between 2009 and 2010. The expansion was led by Texas with a 6 billion kWh increase, followed by Illinois, Indiana, Iowa and North Dakota, each with an increase of over 1 billion kWh. By 2010, wind provided 2 percent of total U.S. generation. All the other remaining renewable sources except other biomass increased as well.
Despite the lingering effects of the recession being felt in financial markets into 2010, competition from low natural gas prices, and an increased reluctance for utilities to enter power purchase agreements with wind, renewable capacity expanded by 3 percent, or 4,019 megawatts (MW) in 2010, according to preliminary data reported to the EIA (Table 4). This was not as large a gain as seen in 2009, but sizeable nonetheless. Some drivers contributing to this growth were:
- Federal Incentives
- For 2010, the federal production tax credit (PTC) provided a 2.2 cent/ kWh credit for all wind facilities in operation by the end of 2012 and closed-loop biomass facilities operating by the end of 2013. A 1.1 cent/ kWH credit was provided for all remaining eligible technologies: open-loop biomass, geothermal energy, landfill gas, municipal solid waste, qualified hydro electric and marine and hydrokinetic (150 kilowatts or larger) in operation by the end of 2013.
- The energy investment tax credit (ITC) was available in lieu of the PTC to those tax payers eligible for the PTC. The ITC was worth 30 percent of expenditures and was available to eligible systems in operation by specific due dates, which are as far away as 2016 for some technologies but just 2012 for wind.
- The Tax Relief, Unemployment Insurance Reauthorization, and Job Creation Act of 2010 (H.R. 4853) was signed in December 2010, and it extended the U.S. Treasury Grant program. Thus, projects in service or under construction by 2011 are eligible. The grant is equal to 30 percent of the basis of property for wind, closed and open loop biomass, geothermal energy, landfill gas, trash, qualified hydropower, marine and hydrokinetic, solar (except passive solar and solar for pool heating), fuel cells, and small wind turbine facilities (up to 100 kilowatts in capacity). The grant is 10 percent of the basis of property for geothermal heat pumps, micro turbines and certain combined heat and power facilities.
- The Renewable Production Incentive (REPI) provided a 2.2 cent per kWH incentive payment for new eligible facilities in operation before October 2016 and owned by local, state and tribal governments; municipal utilities; rural electric cooperatives and native corporations that have no tax liability. It is paid subject to availability of appropriations in each federal fiscal year of operation.
- Renewable portfolio standards or mandates in 37 states and the District of Columbia.
- Transmission expansion like California's new Tehachapi project, which takes electricity to market in Los Angeles and plans for the Texas Competitive Renewable Energy Zone (CREZ).
- Lower cost of silicon used in crystalline silicon PV installations.
Wind expanded by 3,593 MW between 2009 and 2010. Two states had wind capacity for the first time: Delaware with 2 MW and Maryland with 70 MW. In addition, wind expanded in 21 other states. The largest year to year increases were in Texas (573 MW), Illinois (350 MW), Minnesota (328 MW), Wyoming (311 MW) and Oregon (273 MW). Altogether, wind capacity has more than tripled from 11,329 MW in 2006 to 37,889 MW in 2010.
Solar has progressed rapidly from 2006, when it had central station capacity in just two states, California (402 MW) and Arizona (9 MW).4 By 2010 it had expanded to a total of 15 states with capacity of 888 MW (Table 8). The largest states were California (460 MW), Nevada (137 MW), Florida (125 MW), Colorado (33 MW), and North Carolina (33 MW). Four states were new in 2010.
Data Revisions
Estimates of energy consumption at geothermal power plants were revised to reflect application of the fossil fuel equivalent heat rate instead of the estimated geothermal plant heat rate in converting electricity generation (Kwh) to Btus. This eliminated the inconsistency between the treatment of geothermal energy and other noncombustible renewable energy forms (conventional hydro, solar and wind) and thus put them on a comparable basis for analysis. For 2009, this resulted in a decrease in total geothermal energy consumption from 369 to 200 trillion Btu.
Notes
1See U.S. Environmental Protection Agency http://www.epa.gov/otaq/fuels/renewablefuels/regulations.htm.
2 U.S. Energy Information Administration (EIA), Monthly Energy Review (MER) 2011, DOE/EIA-0035 (2011) (Washington, DC, March 2011), Table 10.3.
3U.S. Energy Information Administration, Electric Power Monthly (EPM) March 2011 (Washington, DC, March 2011), Table 1.1 and Table 1.1A.
4U.S. Energy Information Administration, Renewable Energy Annual 2007 (Washington DC, April 2009), Table 1.23.