
U.S. ENERGY INFORMATION ADMINISTRATION
WASHINGTON DC 20585
FOR IMMEDIATE RELEASE
December 1, 2015
EIA now provides monthly state-level estimates of small-scale solar PV capacity and generation
With the release of today's Electric Power Monthly (EPM), the U.S. Energy Information Administration (EIA) begins regular reporting of monthly estimates of small-scale distributed solar photovoltaic (PV) electricity generation and capacity by state and sector. Until now, EIA had provided monthly state-level data only for utility-scale generation sources, including solar, but only annual national-level generation and capacity estimates for small-scale solar PV.
EIA estimates total U.S. solar generation was 3.5 million megawatthours in September 2015, with 33% coming from small-scale solar PV and 67% from utility-scale solar. Overall U.S. solar generation was equivalent to about 1% of the total reported electricity generation from all utility-scale sources of 351 million megawatthours in September 2015.
"Generation from roof-top PV systems has become an increasingly important part of total solar generation in the United States. The new monthly reporting on small-scale distributed solar PV systems gives the country a better way to track their contribution to the nation's electricity supply," said EIA Administrator Adam Sieminski.
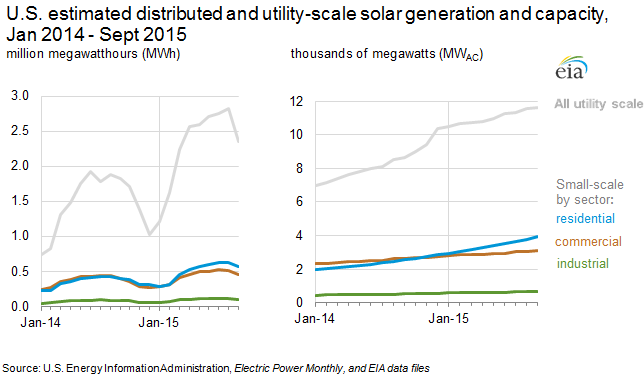
Small-scale distributed solar photovoltaic (PV) systems, such as those found on residential and commercial rooftops, have grown significantly in the United States over the past several years. Small-scale PV installations are often called "behind-the-meter," "customer-sited," or "distributed generation" capacity. Although each distributed PV system is very small—a typical size for residential PV systems is 5 kilowatts (kW) or 0.005 megawatts (MW)—there are hundreds of thousands of these systems across the country that together add up to a substantial amount of capacity.
Almost 40% of the distributed PV capacity in the United States is located in California. The next nine states after California account for another 44% (see graphic). California's leadership in distributed solar capacity is driven by a combination of factors, including high electricity prices, a large population, strong solar resources, and state policies and incentives that support solar PV.
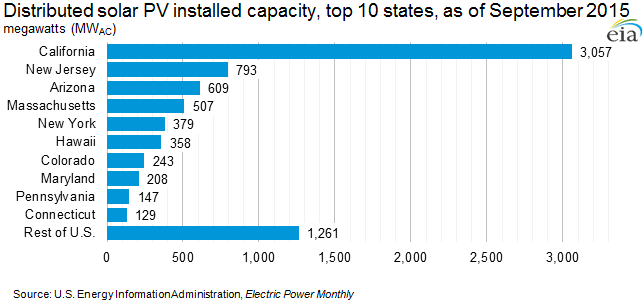
Other top states for small-scale PV share some but not all of these factors. New Jersey, Massachusetts, and New York are among the top distributed solar states because of significant state solar PV policies and incentives despite having average to below-average solar resources. Other states, like Arizona, have incentive programs and strong solar resources. Hawaii, despite having a small population, has strong solar resources and high electricity prices, which make rooftop solar PV systems economically attractive.
EIA's Electric Power Monthly, which includes the new monthly estimates for small-scale distributed solar PV from January 2014 through September 2015, can be found at:
http://www.eia.gov/electricity/monthly/
EIA Program Contact: Carolyn Moses, 202-287-6314, carolyn.moses@eia.gov
EIA Press Contact: Jonathan Cogan, 202-586-8719, jonathan.cogan@eia.gov
EIA-2015-11