
U.S. ENERGY INFORMATION ADMINISTRATION
WASHINGTON DC 20585
FOR IMMEDIATE RELEASE
April 14, 2015
EIA's AEO2015 projects that U.S. energy imports and exports come into balance, a first since the 1950s, because of continued oil and natural gas production growth and slow growth in energy demand
The Annual Energy Outlook 2015 (AEO2015) released today by the U.S. Energy Information Administration (EIA) presents updated projections for U.S. energy markets through 2040 based on six cases (Reference, Low and High Economic Growth, Low and High Oil Price, and High Oil and Gas Resource) that reflect updated scenarios for future crude oil prices.
"EIA's AEO2015 shows that the advanced technologies are reshaping the U.S. energy economy," said EIA Administrator Adam Sieminski. "With continued growth in oil and natural gas production, growth in the use of renewables, and the application of demand-side efficiencies, the projections show the potential to eliminate net U.S. energy imports in the 2020 to 2030 timeframe. The United States has been a net importer of energy since the 1950s. In cases with the highest supply and lowest demand outlooks, the United States becomes a significant net exporter of energy," said Mr. Sieminski.
Some key findings:
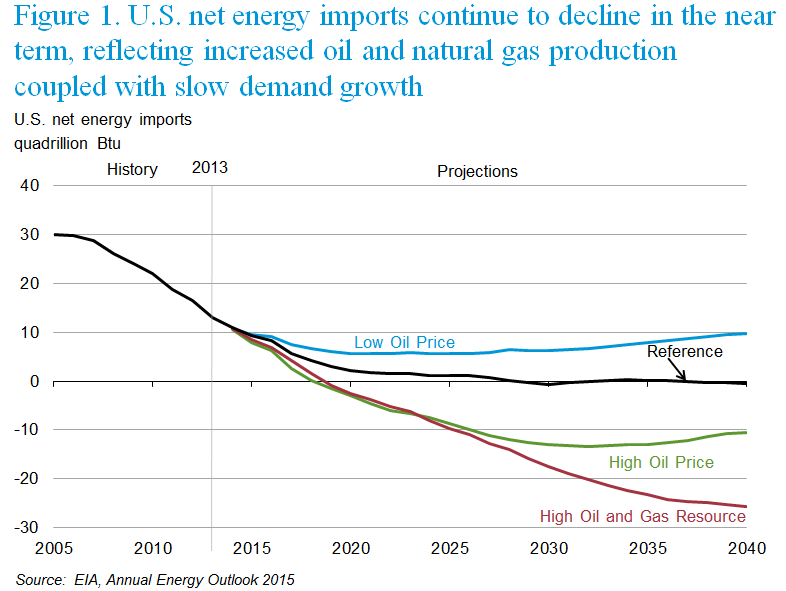
U.S. net energy imports decline and ultimately end in most AEO2015 cases, driven by growth in U.S. energy production—led by crude oil and natural gas—increased use of renewables, and only modest growth in demand. Net energy imports end before 2030 in the AEO2015 Reference case and before 2020 in the High Oil Price and High Oil and Gas Resource cases (Figure 1). Significant net energy imports persist only in the Low Oil Price and High Economic Growth cases, where U.S. supply is lower and demand is higher.
Continued strong growth in domestic production of crude oil from tight formations reduces net imports of petroleum and other liquids. Through 2020, strong growth in domestic crude oil production from tight formations leads to a decline in net petroleum imports and growth in product exports in all AEO2015 cases. The net import share of petroleum and other liquids product supplied falls from 26% in 2014 to 15% in 2025 and then rises slightly to 17% in 2040 in the Reference case. With greater U.S. crude oil production in the High Oil Price and High Oil and Gas Resource cases, the United States becomes a net petroleum exporter after 2020.
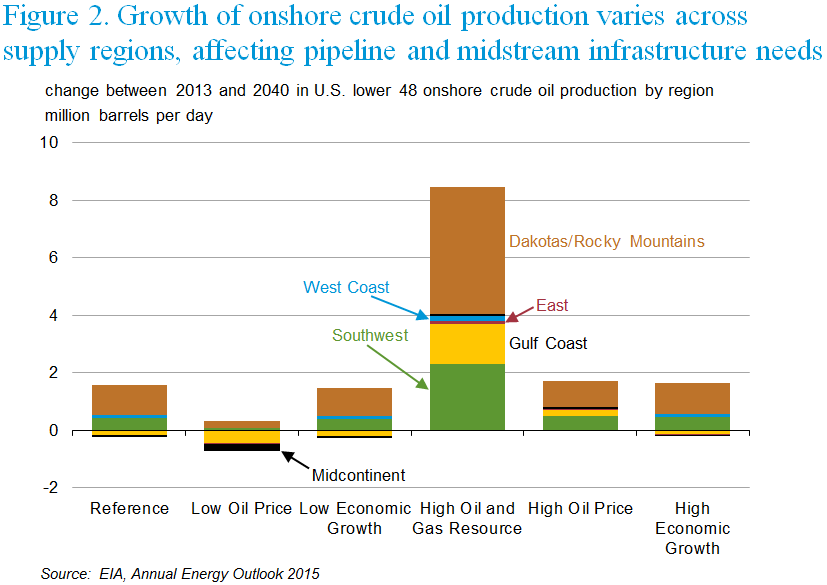
Regional variations in domestic crude oil and natural gas production can force significant shifts in crude oil and natural gas flows between U.S. regions, requiring investment in or realignment of pipelines and other midstream infrastructure. In most AEO2015 cases, Lower 48 crude oil production shows the strongest growth in the Dakotas/Rocky Mountains region, followed by the Southwest region (Figure 2). The strongest growth of natural gas production occurs in the East region, followed by the Gulf Coast onshore and the Dakotas/Rocky Mountains regions. Interregional flows to serve downstream markets vary significantly among the cases.
Technology and policy promote slower growth of energy demand. U.S. energy use grows at 0.3%/year from 2013 through 2040 in the Reference case, far below the rates of economic growth (2.4%/year) and population growth (0.7%/year). Decreases in transportation and residential sector energy consumption partially offset growth in other sectors. Declines in energy use reflect the use of more energy-efficient technologies as well as the effect of existing policies that promote increased energy efficiency. Fuel economy standards and changing driver behavior keep motor gasoline consumption below recent levels through 2040 in the Reference case.

Energy-related carbon dioxide emissions stabilize with improvements in energy and carbon intensity of electricity generation. Improved efficiency in the end-use sectors and a shift away from more carbon-intensive fuels help to stabilize U.S. energy-related carbon dioxide (CO2) emissions, which remain below the 2005 level through 2040.
Other AEO2015 highlights:
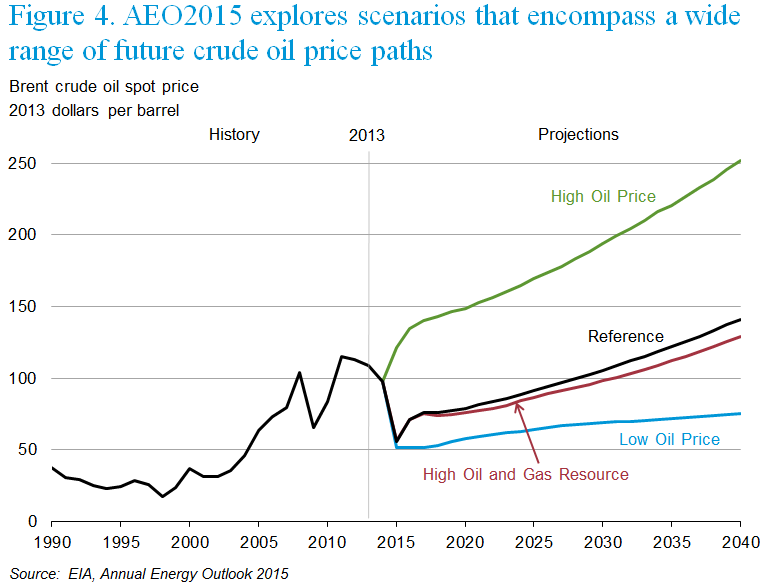
- In the AEO2015 Reference case, the price of global marker Brent crude oil is $56/barrel (bbl) (in 2013 dollars) in 2015 (Figure 4). Prices rise steadily after 2015 in response to growth in demand; however, downward price pressure from rising U.S. crude oil production keeps the Brent price below $80/bbl through 2020. U.S. crude oil production starts to decline after 2020, but increased output from non-OECD and OPEC producers helps to keep the Brent price below $100/bbl through most of the next decade and limits price increases through 2040, when Brent reaches roughly $140/bbl. There is significant variation in the alternative cases. In the Low Oil Price case, the Brent price is $52/bbl in 2015 and reaches $76/bbl in 2040. In the High Oil Price case, the Brent price reaches $252/bbl in 2040. In the High Oil and Gas Resource case, with significantly more U.S. production than the Reference case, Brent is under $130/bbl in 2040, more than $10/bbl below its Reference case price.
- Total U.S. primary energy consumption grows from 97.1 quadrillion Btu in 2013 to 105.7 quadrillion Btu in 2040 in the AEO2015 Reference case with most of the growth in natural gas and renewable energy use. In the High Oil Price case, total primary energy use is 3.9 quadrillion Btu higher in 2040 than in the Reference case, even though liquids consumption is 3.3 quadrillion Btu lower. Total primary energy consumption is very sensitive to economic growth assumptions, with projected levels in 2040 ranging from 98.0 quadrillion Btu in the Low Economic Growth case to 116.2 quadrillion Btu in the High Economic Growth case.
- In the AEO2015 Reference case, energy use per dollar of GDP declines at an annual rate of 2.0% from 2013 through 2040, as per capita energy use declines at an annual rate of 0.4%. Energy intensity declines at a lower rate in the Low Economic Growth case and at a slightly higher rate in the High Economic Growth case.
- In the AEO2015 Reference case projection, U.S. energy-related CO2 emissions are roughly 5,550 million metric tons (mt) in 2040. As renewable fuels and natural gas account for larger shares of total energy consumption, CO2 emissions per unit of GDP decline by 2.3%/year from 2013 to 2040. Among the alternative cases, emissions show the greatest sensitivity to levels of economic growth, with 2040 totals varying from roughly 5,980 million mt in the High Economic Growth case to 5,160 million mt in the Low Economic Growth case. In all the AEO2015 cases, emissions remain below the 2005 level of 5,993 million mt.
- The AEO2015 cases generally reflect current policies, including final regulations and the sunset of tax credits under current law. Consistent with this approach, EPA’s proposed Clean Power Plan rules for existing fossil-fired electric generating units or the effects of relaxing current limits on crude oil exports are not considered in AEO2015. These topics will be addressed in forthcoming EIA service reports.
To focus more resources on rapidly changing energy markets and the ways in which they might evolve over the next few years, EIA has revised the schedule and approach for production of the AEO. Starting with AEO2015, EIA is adopting a two-year release cycle for the AEO, with a full edition of the AEO produced in alternating years and a shorter edition in the other years. AEO2015 is a shorter edition of the AEO. The projections from the AEO2015 Reference and alternative cases are available at http://www.eia.gov/outlooks/aeo/.
EIA Program Contact: John Conti, 202-586-2222, john.conti@eia.gov
EIA Press Contact: Jonathan Cogan, 202-586-8719, jonathan.cogan@eia.gov
EIA-2015-03