
U.S. ENERGY INFORMATION ADMINISTRATION
WASHINGTON DC 20585
FOR IMMEDIATE RELEASE
December 16, 2013
Growing oil and natural gas production continues to reshape the U.S. energy economy
WASHINGTON, DC - The Annual Energy Outlook 2014 (AEO2014) Reference case released today by the U.S. Energy Information Administration (EIA) presents updated projections for U.S. energy markets through 2040.
"EIA's updated Reference case shows that advanced technologies for crude oil and natural gas production are continuing to increase domestic supply and reshape the U.S. energy economy as well as expand the potential for U.S. natural gas exports," said EIA Administrator Adam Sieminski. "Growing domestic hydrocarbon production is also reducing our net dependence on imported oil and benefiting the U.S. economy as natural-gas-intensive industries boost their output," said Mr. Sieminski.
Some key findings:
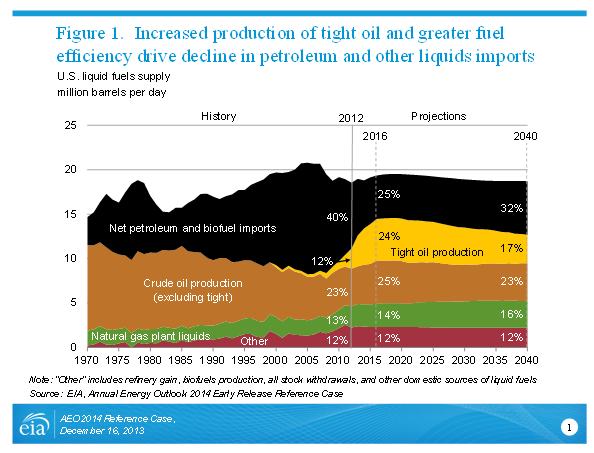
Domestic production of oil and natural gas continues to grow. Domestic crude oil production increases sharply in the AEO2014 Reference case, with annual growth averaging 0.8 million barrels per day (MMbbl/d) through 2016, when domestic production comes close to the historical high of 9.6 MMbbl/d achieved in 1970 (Figure 1). While domestic crude oil production is projected to level off and then slowly decline after 2020 in the Reference case, natural gas production grows steadily, with a 56% increase between 2012 and 2040, when production reaches 37.6 trillion cubic feet (Tcf). The full AEO2014 report, to be released this spring, will also consider alternative resource and technology scenarios, some with significantly higher long-term oil production than the Reference case.
Low natural gas prices boost natural gas-intensive industries. Industrial shipments grow at a 3.0% annual rate over the first 10 years of the projection and then slow to a 1.6% annual growth over the balance of the projection. Bulk chemicals and metals-based durables account for much of the increased growth in industrial shipments. Industrial shipments of bulk chemicals, which benefit from an increased supply of natural gas liquids, grow by 3.4% per year from 2012 to 2025, although the competitive advantage in bulk chemicals diminishes in the long term. Industrial natural gas consumption is projected to grow by 22% between 2012 and 2025.
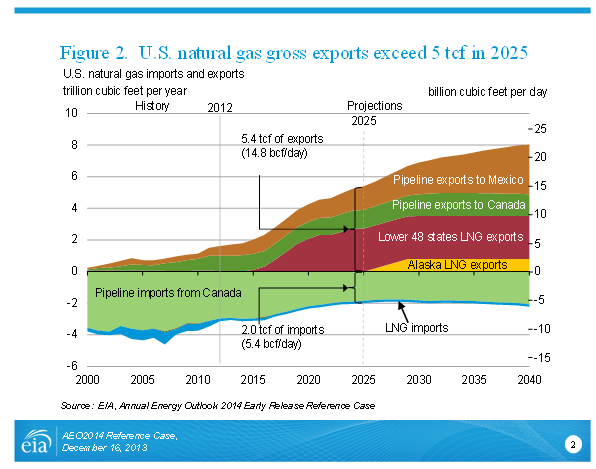
Higher natural gas production also supports increased exports of both pipeline and liquefied natural gas (LNG). In addition to increases in domestic consumption in the industrial and electric power sectors, U.S. exports of natural gas also increase in the AEO2014 Reference case (Figure 2). U.S. exports of LNG increase to 3.5 Tcf before 2030 and remain at that level through 2040. Pipeline exports of U.S. natural gas to Mexico grow by 6% per year, from 0.6 Tcf in 2012 to 3.1 Tcf in 2040, and pipeline exports to Canada grow by 1.2% per year, from 1.0 Tcf in 2012 to 1.4 Tcf in 2040. Over the same period, U.S. pipeline imports from Canada fall by 30%, from 3.0 Tcf in 2012 to 2.1 Tcf in 2040, as more U.S. demand is met by domestic production.
Car and light trucks energy use declines sharply, reflecting slow growth in travel and accelerated vehicle efficiency improvements. AEO2014 includes a new, detailed demographic profile of driving behavior by age and gender as well as new lower population growth rates based on updated Census projections. As a result, annual increases in vehicles miles traveled (VMT) in light-duty vehicles (LDV) average 0.9% from 2012 to 2040, compared to 1.2% per year over the same period in AEO2013. The rising fuel economy of LDVs more than offsets the modest growth in VMT, resulting in a 25% decline in LDV energy consumption decline between 2012 and 2040 in the AEO2014 Reference case.
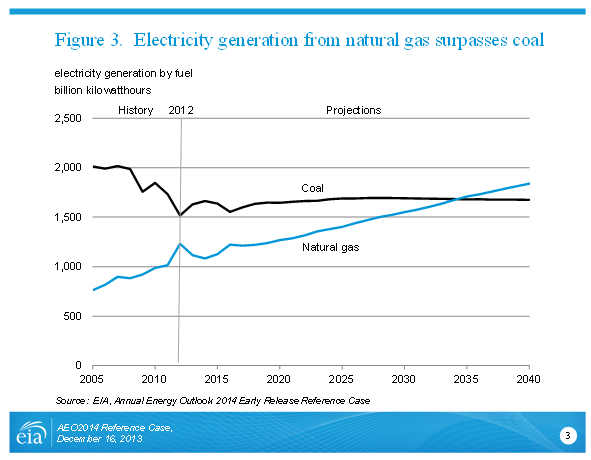
Natural gas overtakes coal to provide the largest share of U.S. electric power generation. Projected low prices for natural gas make it a very attractive fuel for new generating capacity. In some areas, natural-gas-fired generation replaces power formerly supplied by coal and nuclear plants. In 2040, natural gas accounts for 35% of total electricity generation, while coal accounts for 32% (Figure 3). Generation from renewable fuels, unlike coal and nuclear power, is higher in the AEO2014 Reference case than in AEO2013. Electric power generation from renewables is bolstered by legislation enacted at the beginning of 2013 extending tax credits for generation from wind and other renewable technologies.
Other AEO2014 Reference case highlights:
- The Brent crude oil spot price declines from $112 per barrel (bbl) (in 2012 dollars) in 2012 to $92/bbl in 2017. After 2017, the Brent spot oil price increases, reaching $141/bbl in 2040 due to growing demand that requires the development of more costly resources. World liquids consumption grows from 89 MMbbl/d in 2012 to 117 MMbbl/d in 2040, driven by growing demand in China, India, Brazil, and other developing economies.
- Total U.S. primary energy consumption grows by just 12% between 2012 and 2040. The fossil fuel share of total primary energy demand falls from 82% of total U.S. energy consumption in 2012 to 80% in 2040 as consumption of petroleum-based liquid fuels falls, largely as a result of slower growth in LDV VMT and increased vehicle efficiency.
- Energy use per 2005 dollar of gross domestic product (GDP) declines by 43% from 2012 to 2040 in AEO2014 as a result of continued growth in services as a share of the overall economy, rising energy prices, and existing policies that promote energy efficiency. Energy use per capita declines by 8% from 2012 through 2040 as a result of improving energy efficiency and changes in the way energy is used in the U.S. economy.
- With domestic crude oil production rising to 9.5 MMbbl/d in 2016, the net import share of U.S. petroleum and other liquids supply will fall to about 25%. With a decline in domestic crude oil production after 2019 in the AEO2014 Reference case, the import share of total petroleum and other liquids supply will grow to 32% in 2040, still lower than the 2040 level of 37% in the AEO2013 Reference case.
- Total U.S. energy-related CO2 emissions remain below their 2005 level (6 billion metric tons) through 2040, when they reach 5.6 billion metric tons. CO2 emissions per 2005 dollar of GDP decline more rapidly than energy use per dollar, to 56% below their 2005 level in 2040, as lower-carbon fuels account for a growing share of total energy use.
The Reference case projections from the Early Release Overview of the AEO2014 are available at http://www.eia.gov/outlooks/aeo/er/. The reference case projections include only the effects of policies that have been implemented in law or regulations. The full AEO2014 report, including projections based on differing assumptions regarding world oil prices, domestic hydrocarbon resources, the rate of economic growth, the characteristics of new technologies, and alternative policy scenarios, will be released in early 2014, along with regional projections.
EIA Program Contact: John Conti, 202-586-2222, john.conti@eia.gov
EIA Press Contact: Jonathan Cogan, 202-586-8719, jonathan.cogan@eia.gov
EIA-2013-17