
U.S. ENERGY INFORMATION ADMINISTRATION
WASHINGTON DC 20585
FOR IMMEDIATE RELEASE
April 11, 2013
New state energy portal gives users interactive access to customized maps and charts of state energy data
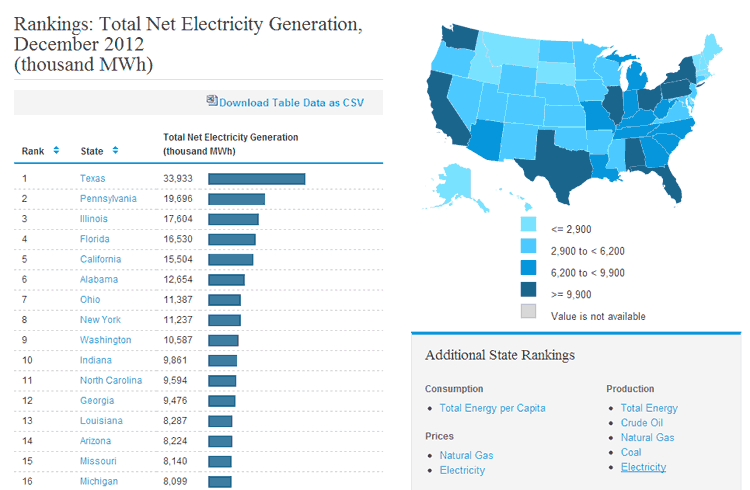
The U.S. Energy Information Administration (EIA) has launched the most comprehensive, dynamic, and interactive view of the U.S. government's national and state energy data and information currently available to the public. Found at www.eia.gov/state, the state energy portal adds a unique visual dimension to each state's energy resources and infrastructure.
The agency designed the new portal with a range of users in mind, including policy makers, energy analysts, and the general public, who want to locate and compare state energy data and rankings and customize their own maps and charts, using an assortment of interactive tools.
"The EIA state energy portal raises the bar for visually segmenting state-level energy data. It provides a wealth of energy information to a wide variety of users, including state officials wanting detailed information on the mix of energy resources in their state, analysts assessing a state's energy sustainability, or government officials seeking the most comprehensive energy information to help develop energy policy," said EIA Administrator Adam Sieminski.
The portal takes EIA's vast portfolio of state energy data and analyses and organizes it geographically. Its comprehensive 30-layer mapping feature provides a dynamic visual representation of energy infrastructure and energy resources at the national, state, Congressional district, or county level. Map layers for Federal lands and Electric Reliability regions are also included.
Users can pan and zoom in to see energy facilities and resources related to:
- Production: power plants, oil refineries, and coal mines
- Distribution: electric transmission lines, natural gas pipelines, and liquefied natural gas import terminals
- Fossil fuel resources: coal, oil, and natural gas basins, plays, and fields
- Renewable energy resources: wind, solar, biomass, and geothermal potential
In addition to customizable maps, the portal summarizes each state's ranking of its energy production, consumption, prices, and more. With a click of a mouse, users can dig deeper into any state's energy profile to learn more about its crude oil and natural gas production, renewable resources, natural gas and electricity prices, and carbon dioxide emissions and compare that data to other states and the national average. For detailed information on any of the 6,300 power plants in the United States, such as the amount of fuel used and monthly output of a specific facility, the portal links users directly to that plant's data in EIA's electricity data browser.
The new portal is EIA's response to requests from policy makers and energy experts for quick access to multi-level state energy data presented in an easy-to-understand way. EIA collaborated with state energy officials and other stakeholders on the portal's design and solicited feedback from the public during the beta phase of the project.
The state energy portal includes a help function with popup notes that explain the navigation, along with a video demonstration of its features.
EIA Program Contact: Mark Elbert, 202-586-1185, mark.elbert@eia.gov
EIA Press Contact: Jonathan Cogan, 202-586-8719, jonathan.cogan@eia.gov
EIA-2013-5