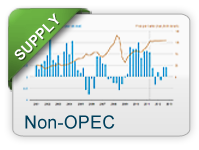


What drives crude oil prices: Supply Non-OPEC
Oil production from countries outside the Organization of the Petroleum Exporting Countries (OPEC) currently represents about 60 percent of world oil production. Key centers of non-OPEC production include North America, regions of the former Soviet Union, and the North Sea.
In contrast to OPEC oil production, which is subject to central coordination, non-OPEC producers make independent decisions about oil production. Also, in contrast to OPEC, where oil production is mostly in the hands of national oil companies (NOCs), international or investor-owned oil companies (IOCs) perform most of the production activities in non-OPEC countries. IOCs seek primarily to increase shareholder value and make investment decisions based on economic factors. While some NOCs operate in a similar manner as IOCs, many have additional objectives such as providing employment, infrastructure, or revenue that impact their country in a broader sense. As a result, non-OPEC investment, and thus future supply capability, tends to respond more readily to changes strictly in market conditions.
Producers in non-OPEC countries are generally regarded as price takers, that is, they respond to market prices rather than attempt to influence prices by managing production. As a result, non-OPEC producers tend to produce at or near full capacity and so have little spare capacity. Other things being equal, lower levels of non-OPEC supply tend to put upward pressure on prices by decreasing total global supply and increasing the "call on OPEC." The greater the call on OPEC, the greater is its likely ability to influence prices.
Non-OPEC production occurs largely in areas that have relatively high finding and production costs, as most of the lower cost conventional oil resources are in OPEC member countries. Non-OPEC producers have therefore led the way into frontier areas such as the deepwater offshore, and pursued unconventional sources such as oil sands. As a result, non-OPEC production usually has a cost disadvantage compared to OPEC production.
Non-OPEC producers have often led in developing new production technology. While this has sometimes resulted in the development of higher-cost supplies, costs often fall as technology advances, which can ultimately put downward pressure on prices.
In addition to non-OPEC crude oil production, natural gas production provides additional supplies of liquids, called natural gas liquids (NGLs). Rising natural gas production in recent years has resulted in substantial increases in NGLs. This has contributed to total world liquids supply and helped to mitigate price increases.
While increases in non-OPEC supply contribute to lower oil prices, disruptions of non-OPEC production reduce global oil supply and can lead to higher oil prices. These unplanned outages can persist for long periods of time. The uncertainty about when the production will return to markets further adds to price volatility.
Oil prices are not only affected by actual non-OPEC production, but also by changes in expectations about future non-OPEC supply. From 2005 through 2008, final production reports for non-OPEC production were consistently lower than forecast expectations. This reduction in anticipated production forced the world to unexpectedly rely more heavily on OPEC crude, drawing down their levels of spare capacity. The downward revisions in expectations of non-OPEC production contributed to upward pressure on oil prices.