Genealogy of Major U.S. Refiners
Release date: September 18, 2013
 The structure of the U.S. petroleum refining industry has changed substantially over the past several years.
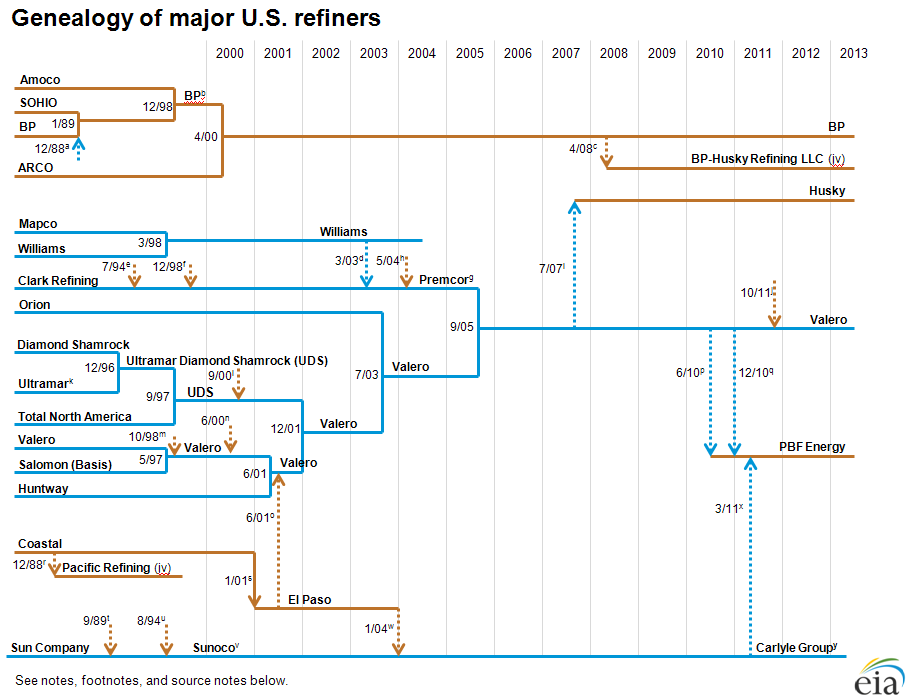
In the diagram the companies shown on the right side are presently active in U.S. refining. The transactions over the past 25 years that created these companies also are shown. The transactions included here may be as little as a single refinery, or as much as all the refining assets of the parties to the transaction. Transactions that include less than all refining assets are indicated by vertical dotted lines while vertical solid lines indicate that all refining assets are included. Additionally, transactions represented by dotted lines are footnoted to indicate the assets included in the transaction. (The dates given for the transactions are intended to be the date the transaction closed. Please forward any corrections to the contacts below.)
For simplicity many of the transactions are represented by a dotted line with no origin that terminates at the acquiring company (represented by a solid horizontal line). The selling company for these transactions is indicated in the associated footnote. Further, these transactions are represented by a contrasting color (relative to the color of the acquiring company) and the direction of the transaction is shown by an arrow at the end of the dotted line.
See full Genealogy of Major U.S. Refiners with notes and sources