The United States uses a mix of energy sources
The United States uses and produces many different types and sources of energy, which can be grouped into general categories such as primary, secondary, renewable, or fossil fuels.
Primary energy sources include fossil fuels (petroleum, natural gas, and coal), nuclear energy, and renewable sources of energy. Electricity is a secondary energy source that is generated (produced) from primary energy sources.
Energy sources are measured in different physical unit: liquid fuels in barrels or gallons, natural gas in cubic feet, coal in short tons, and electricity in kilowatts and kilowatthours. In the United States, the British thermal unit (Btu), a measure of heat energy, is commonly used for comparing different types of energy to each other. In 2023, total U.S. primary energy consumption was equal to about 94 quadrillion Btu.
- There are five energy-use sectors, and the amounts—in quadrillion Btu (or quads)—of their primary energy consumption in 2023 were:1
- electric power32.11quads
- transportation27.94quads
- industrial22.56quads
- residential6.33quads
- commercial4.65quads
In 2023, the electric power sector accounted for about 96% of total U.S. utility-scale electricity generation, nearly all of which was sold to the other sectors. Utility-scale electricity generation includes generation from power plants with at least one megawatt of electric generation capacity.
The transportation, industrial, residential, and commercial sectors are called end-use sectors because they consume primary energy and electricity produced by and purchased from the electric power sector.
- Energy end-use by each end-use sector in 2023 was:1
- transportation27.96quads
- industrial26.06quads
- residential11.30quads
- commercial9.34quads
Total energy consumption by the end-use sectors includes their primary energy use, purchased electricity, electrical system energy losses (energy conversion and other losses associated with the generation, transmission, and distribution of purchased electricity), and other energy losses.
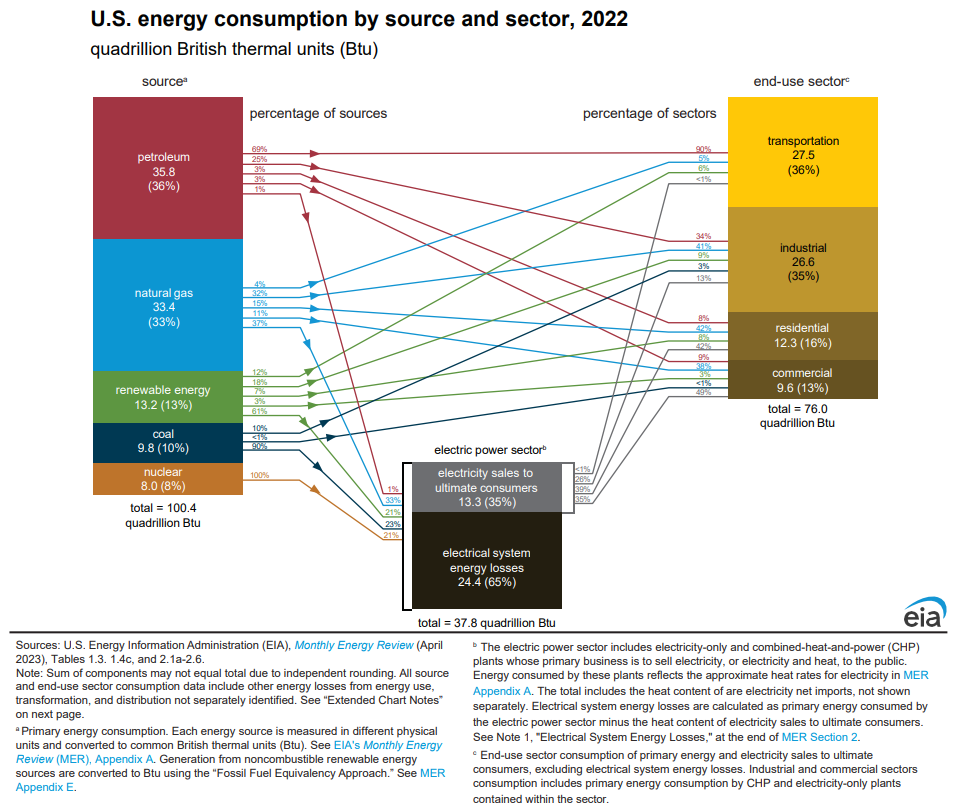
The sources of energy used by each sector vary widely. For example, in 2023, petroleum provided about 89% of the transportation sector's primary energy consumption but less than 1% of the electric power sector's primary energy consumption. The chart below shows the types and amounts of primary energy sources consumed in the United States, the amounts of primary energy consumed by the electric power sector and the energy end-use sectors, and sales of electricity by the electric power sector to the energy end-use sectors.
U.S. energy production has been greater than U.S. energy consumption in recent years
U.S. total annual energy production has exceeded total annual energy consumption since 2019. In 2023, production was about 102.83 quads and consumption was 93.59 quads.
Fossil fuels—petroleum, natural gas, and coal—accounted for about 84% of total U.S. primary energy production in 2023.
- The percentage shares and amounts (in quads) of total U.S. primary energy production by major sources in 2023 were:2
- Natural gas38%39.25 quads
- Petroleum (crude oil and natural gas plant liquids)34%35.24 quads
- Renewable energy8%8.43 quads
- coal11%11.81 quads
- Nuclear electric power8%8.10 quads
The mix of U.S. energy consumption and production has changed over time
Fossil fuels have dominated the U.S. energy mix for more than 100 years, but the mix has changed over time.2
Petroleum's share of total U.S. energy consumption peaked in the 1970s. In 1978, total petroleum consumption was about 49% (38 quads) of total U.S. energy consumption. In 2023, petroleum's share of total U.S. energy consumption was about 38% (35 quads). U.S. petroleum consumption decreased in 2020, largely as a result of the response to the COVID-19 pandemic, and increased in subsequent years as the economy returned to pre-pandemic activity.
Annual crude oil production generally decreased between 1970 and 2008. The trend reversed in 2009, and crude oil production reached a record high in 2019. More cost-effective oil well drilling and production technologies, notably in tight oil and shale deposits, has helped to drive increases in annual crude oil production. U.S. total annual crude oil production was lower in 2020 and 2021, in part, because of the COVID-19 pandemic’s effect on U.S. petroleum product demand. Total annual U.S. crude oil production was higher in 2023 because U.S. oil producers responded to increases in U.S. and world petroleum demand and to increases in oil prices.
Annual natural gas plant liquids (NGPL) production has generally increased since 2005, coinciding with increases in natural gas production, and reached a record high in 2023. NGPLs are the largest source of U.S. hydrocarbon gas liquids (HGL) production. Annual increases in HGL production since 2008 have contributed to lower HGL prices and to increased U.S. HGL consumption and exports.
Natural gas consumption has increased both in amount and share of U.S. energy consumption. In 1950, natural gas consumption was about 18% (5.97 quads) of total U.S. primary energy consumption, and in 2023, natural gas consumption was about 36% (33.61 quads) of total U.S. primary energy consumption. U.S. annual dry natural gas production has exceeded U.S. annual natural gas consumption in both volume and heat content since 2017. More efficient natural gas and oil well drilling and production techniques have resulted in increases in natural gas production from shale and tight geologic formations. The production increases generally contributed to a decline in U.S. natural gas prices through 2020, which, in turn, contributed to increases in natural gas consumption by the electric power and industrial sectors.
Renewable energy production and consumption both reached record highs in 2023: production was about 9% (8.43 quads) of total primary energy production and consumption was about 9% (8.24 quads) of total primary energy consumption. The increases in recent years have been driven mainly by large increases in solar and wind energy production. Hydropower generation in 2023 was about 6% lower higher than in 2022. Total biomass energy production and consumption in 2023 were both higher than in 2022 but lower than the record highs in 2018. Biofuels accounted for about 53% of total biomass consumption in 2023. Geothermal energy consumption reached a record high in 2023.
The contribution of coal to total U.S. energy consumption has declined from about 37% in 1950 to 9% in 2023, largely because the U.S. electric power sector has increased use of other energy sources and reduced coal consumption. In terms of coal's total primary energy content, annual U.S. coal consumption peaked in 2005 at about 22.80 quads and production peaked in 1998 at about 24.05 quads. The energy content of total annual coal consumption has declined largely because the electric power sector has increased use of lower heat content coal. In 2023, coal production accounted for about 11% (11.81 quads) of U.S. total energy production.
Nuclear energy production in commercial nuclear power plants in the United States began in 1957, grew each year through 1990 as the number of nuclear power plants and nuclear electricity generation capacity increased, and generally leveled off from 2001 through 2019. Nuclear energy's share of U.S. energy consumption peaked in 2020 at about 9% (8.25 quads). A combination of reactor upgrades and shorter refueling and maintenance cycles at nuclear power plants helped to compensate for fewer operating nuclear reactors since the 1990s. In 2020 through 2022, total annual nuclear electricity generation declined after two nuclear plants retired in 2020, one plant in 2021, and another plant in 2022. Nuclear electricity generation increased in 2023 over 2022 because a new reactor went online during the year. In 2023, nuclear energy's share of total U.S. energy consumption was about 9% (8.10 quads).
1 U.S. Energy Information Administration, Monthly Energy Review, Energy consumption by sector, Tables 2.1.a and 2.1.b, April 2024, preliminary data.
2 U.S. Energy Information Administration, Monthly Energy Review, Energy Overview, Table 1.2, April 2024, preliminary data.
Last updated: July 15, 2024, with data from the Monthly Energy Review, April 2024; data for 2023 are preliminary.