How Were Buildings Selected for the 2012 CBECS?
Background and overview
Did you know?
In the CBECS, commercial refers to any structure that is neither residential, manufacturing/industrial, nor agricultural. building refers to a structure that is totally enclosed by walls that extend from the foundation to the roof.
Data collection for the 2012 Commercial Buildings Energy Consumption Survey (CBECS) took place between April and November 2013, collecting data for reference year 2012. The goal of the CBECS is to provide statistical information about energy consumption and expenditures in U.S. commercial buildings and information about energy-related characteristics of these buildings.
The 2012 CBECS estimates that there were 5.6 million commercial buildings in the U.S. in 2012. Because it would be impractical and prohibitively expensive to conduct interviews at all 5.6 million buildings, the Energy Information Administration (EIA) used a statistical sample that was designed to represent the entire population. For the 2012 CBECS, the final sample size was just over 6,700 completed building interviews (over a 28 percent increase from the number of buildings in the 2003 CBECS). Trained field staff conducted interviews with building owners, managers, and other personnel to collect data at each of the buildings.
In order to select a statistically valid sample that will produce accurate statistics about the commercial buildings population, each building must have one and only one chance (probability) of selection, and the probability must be known. To do this, there has to be a frame or list of commercial buildings. Currently there is no existing comprehensive sampling frame of U.S. commercial buildings, so EIA must construct a frame. The majority of this frame is called the area frame portion; it is comprised of all commercial buildings in statistically selected geographic areas. For selected geographical areas, trained field staff walked or drove through these selected areas and recorded information about every commercial building. The other part of the frame (as much as 20 percent) is called the list frames portion and is made up of lists of buildings from five different sources. The multi-frame approach ensures that all types and sizes of commercial buildings have a chance of selection. More detailed descriptions of the frame types are provided in the sections below. The 2003 CBECS design is also described because it is the foundation of the 2012 CBECS design.
The area frame
The area frame construction is the most difficult, time-consuming, and expensive piece of the CBECS frame, but it is a well-established method that ensures the frame is representative of all commercial buildings in the U.S. As mentioned above, trained field workers visited commercial areas in person and record all commercial buildings. It was not feasible within EIA’s budget for field staff to walk every street in the U.S. to record all commercial buildings for the area frame, so the country was broken up into multiple levels of smaller, more manageable pieces that are statistically selected. This is called multi-stage area probability sampling.
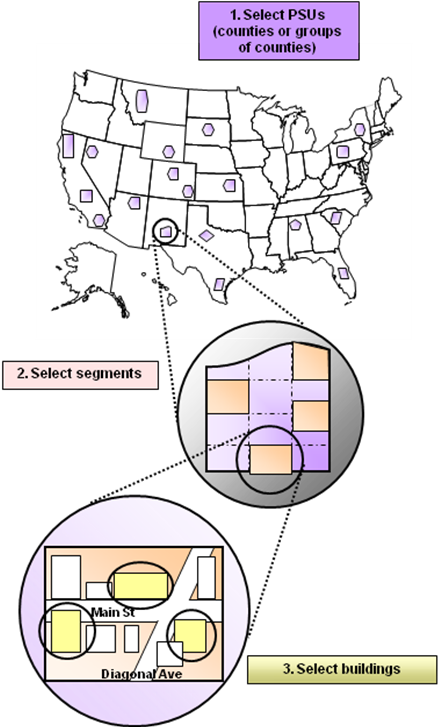
When the area frame was created in 2003, the U.S. was first divided into 687 geographic areas called primary sampling units (PSUs); PSUs are counties or groups of counties. A measure of commercial business activity within each PSU was estimated using the Census Bureau’s County Business Patterns. This measure of business activity is highly correlated with the number of commercial buildings, so it was used as a measure of size to statistically select PSUs with a method called probability proportionate to size (PPS) sampling. PSUs in major cities with substantial commercial activity were selected with certainty. In the 2003 CBECS, 108 PSUs out of a total of 687 were selected. These 108 PSUs were divided further into 7,031 secondary sampling units (SSUs or segments); SSUs are Census tracts or groups of Census tracts. Ultimately, 511 segments were sampled. The field staff (called listers) then constructed the area frame in these selected segments by walking the blocks (or driving the roads in more suburban or rural areas) and carefully writing down name, address, and some other descriptive information about all commercial buildings within the designated boundaries. There were over 140,000 buildings listed on the 2003 CBECS area frame.
The area frame is limited to all those commercial buildings located in the selected areas but the multi-stage area probability sampling method ensures that it is representative of the commercial building population: selected PSUs represent the population at the PSU level, and selected SSUs represent the given PSU at the SSU level.
The list frames
It is desirable to sample large buildings at a higher rate than small buildings because of the relatively large amount and variable sources of energy that is consumed in these buildings - square footage is highly correlated with energy consumption. However, the area sampling procedure cannot provide an optimally efficient mix of large and small buildings to guarantee that a sufficient number of very large buildings would be available for sampling.
To compensate for this inefficiency of the area sample, special lists of large buildings were used to augment the area frame. EIA purchased or obtained five administrative database lists from organizations such as government agencies and trade associations and processed them for the purposes of sampling. There is a possibility that a building could exist in more than one frame, so de-duplicating the frames was essential to ensure that a building has only one chance of selection to avoid biased estimates. After data cleaning and de-duplication, the compilation of these lists provided sufficient coverage of large, energy-intensive buildings. The special lists used were for hospitals, Federal buildings, airports, college campus buildings, and other large (>200,000 square feet) buildings such as offices, shopping malls, and hotels.
Updating the frames for 2012
The area frame and administrative lists used for the 2003 CBECS were a good foundation for the 2012 CBECS frame, but new buildings were constructed and old buildings demolished since 2003. Because it is so expensive and time-consuming to develop, EIA does not create a new area frame for each CBECS (in fact, prior to 2003, the last time a frame was developed from scratch was 1986). However, it is essential to include new buildings in the sample because newly constructed buildings use energy differently than old buildings due to new technologies and construction standards.
Updating the list frames to include new construction was relatively easy; EIA simply obtained the most recent version of each list and replaced the older version. Updating the area frame was trickier – EIA selected a sample of 50 SSUs from the 2003 CBECS and field listers visited these areas in-person to update the frame by adding newly constructed buildings that did not appear on the 2003 frame. These new buildings were sampled at a rate such that the entire stock of buildings constructed since 2003 was adequately represented. In order to accommodate the increase in sample size from 2003, EIA selected 43 new PSUs which were divided into 196 new SSUs and added 61 new SSUs from existing PSUs; listers built a new area frame for these areas. The field work to update the area frame took place during September and October 2012.
Drawing a sample from the frames
After the administrative lists and area frames were updated to reflect the commercial building population in 2012, the sample was selected.
In selecting the buildings, the goal was to optimize survey cost and estimation accuracy for energy consumption. Using the information available on the sampling frame, the buildings were sorted into subgroups with similar qualities by building size and type. The number of sampled buildings within each subgroup was calculated so that the variance of estimated energy consumption was minimized, subject to total sample size and budget constraints: subgroups that have a highly variable total energy consumption, specifically large buildings, were sampled at a higher rate than subgroups where the total energy consumption is less variable. After the optimal sample rates and sizes were calculated in each subgroup, the final sample of buildings was selected using a systematic PPS selection procedure. Each sampled building was assigned a weight, called a "base weight", which is equal to 1 / (probability of selection). This weight is the number of buildings in the population that the building represents (including itself and other similar non-sampled buildings). The base weights are adjusted to account for buildings in the sample that turn out to be ineligible and to represent buildings that did not respond to the survey. The estimated total number of commercial buildings is calculated by adding up the adjusted base weights of all the buildings in the sample.
The initial sample for the 2012 CBECS included just slightly more than 12,000 buildings. A higher number of buildings were sampled relative to the target number of completed interviews to account for buildings that turned out to be ineligible and those which did not respond to the survey.
Specific questions on this product may be directed to CBECS staff.


