
Natural gas inventories end heating season above five-year average
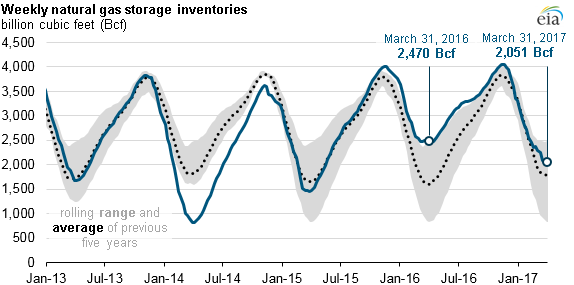
Working natural gas in storage as of March 31, the traditional end of the heating season, totaled 2,051 billion cubic feet (Bcf), or almost 15% above the five-year average according to EIA's Weekly Natural Gas Storage Report. The total inventory of U.S. natural gas in storage tends to follow seasonal patterns of injections through the summer and withdrawals during the winter. Unlike the 2015–2016 heating season’s extremely high levels of natural gas inventories due to mild weather, inventories during the 2016–2017 heating season closely tracked the five-year average (2012-2016) until withdrawals slowed toward the end of the season.
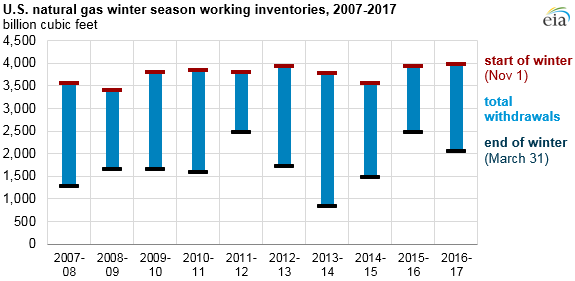
At the end of March 2016, U.S. natural gas storage inventories were near the highest on record for the end of a heating season, totaling 2,470 Bcf, or 54% higher than the previous five-year average (2011-2015). For most of 2016 and continuing into the 2016–2017 heating season, inventories remained above the previous five-year average. Inventories began the most recent heating season at a record of 4,047 Bcf on November 11, 2016, because of relatively warm seasonal weather.
Overall natural gas consumption during the 2016–2017 heating season was about the same as the previous year, but U.S. dry natural gas production fell by 3% over that same period. Natural gas consumption in the residential, commercial, and industrial sectors remained relatively unchanged. Responding to slightly higher natural gas prices, natural gas consumed in U.S. electric power generation fell 2.1 Bcf from the 2015–2016 heating season, but the drop was almost entirely offset by a 2.0 Bcf increase in natural gas exports from the United States, according to data from PointLogic.
EIA’s latest Short-Term Energy Outlook expects an increase in working natural gas inventories of about 1,750 Bcf through this summer’s injection season. The resulting forecast of U.S. natural gas inventories at the end of October 2017 suggests that they will not match the record high end-of-injection-period levels set at the end of October 2016. Similar to recent consumption patterns, consumption in the residential, commercial, and industrial sectors is expected to remain relatively flat on an annual average basis as electric power sector consumption of natural gas declines slightly and gross natural gas exports—especially liquefied natural gas exports—continue to increase.
Principal contributors: Kristen Tsai, Owen Comstock
Tags: capacity, inventories/stocks, natural gas, storage, storage