U.S. electricity sales have decreased in four of the past five years
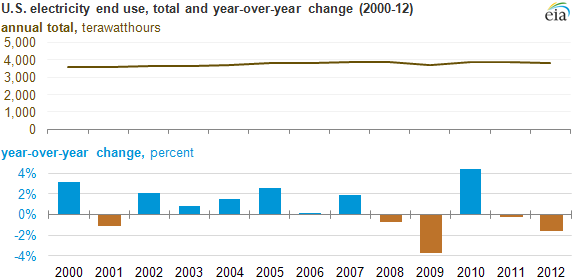
Note: Electricity end use includes both retail electricity sales and the onsite use of power at utility-scale generators.
Total U.S. electricity sales have declined in four of the past five years, and are on track to continue to decline in 2013. The only year-over-year rise in electricity use since 2007 occurred in 2010, as the country exited the 2008-09 recession.
The flattening of total electricity sales has been driven by declining sales in the industrial sector and flat sales in the residential and commercial building sectors, despite growth in the number of households and commercial building space.
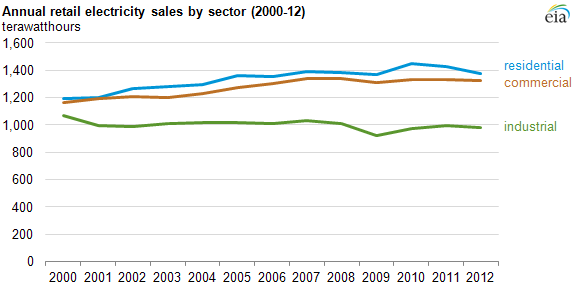
Note: Direct electricity usage and sales to the transportation sector are not graphed as both account for less than 4% of electricity usage.
Residential: Electricity sales to the residential sector (blue line) accounted for 36% of all electricity use in 2012, up from 33% in 2000. In 2010, coming out of the recession, year-over-year residential sales increased 6%, and subsequently declined 5% over the following two years, despite growth in the housing stock and the trend of building larger homes. Weather patterns, which affect electricity demand for home heating and cooling, and efficiency improvements spurred by appliance standards are key drivers for declining energy consumption per household. Other trends such as shifts in population and changes in housing square footage and type (i.e., from single-family homes to apartments) have an impact on residential electricity use.
Commercial: Sales of power to commercial buildings (brown line) have increased about 1% annually since 2000 and accounted for 35% of electricity use in 2012. Demand has varied more than in the residential and industrial sectors. Weather patterns affecting energy needs for heating and cooling, as well as standards to improve efficiency for lighting and space heating, have helped keep commercial building energy demand flat in recent years.
Industrial: Total industrial electricity sales decreased by 9% between 2000 and 2012, and the sector's share of total electricity usage fell from 30% to 26% in that period. Electricity use in the industrial sector has historically been sensitive to economic conditions as factories respond to declining demand for goods. The sector experienced a sharp 10% year-over-year decrease in electricity use during the 2009 recession, and sales have not yet returned to the 2007 level. Efficiency improvements in production processes have contributed to declining energy sales. However, since 2010 this trend has been offset by increasing production and exports, driven by low natural gas prices, among other factors.
Distributed generation: Growth in solar photovoltaic capacity and other types of distributed generation is another factor contributing to the recent slower growth in electricity sales in the residential and commercial sectors. The impact is difficult to measure because residential and commercial solar electricity generation data are not readily available. Growing installed capacity of behind-the-meter sources of generation (largely from rooftop solar) is displacing some electricity sales that would otherwise occur.
EIA's Annual Energy Outlook, released December 16, projects relatively flat electricity use through 2015, after which growth resumes at near historical rates of nearly 1%.
Principal contributor: Robert McManmon, M. Tyson Brown
Tags: consumption/demand, electricity, residential, solar