Summary
U.S. renewable energy consumption grew by 6 percent, from 7.600 quadrillion Btu in 2009 to 8.090 quadrillion Btu in 2010. The relative share of renewable energy to total energy consumption has grown to 8 percent in 2010.
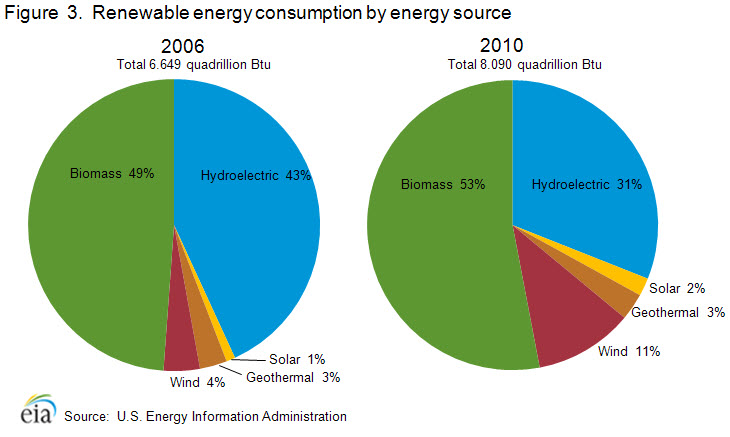
Of the major renewable fuel categories, biomass accounted for over half (53 percent) of total renewable energy consumption in 2010, while hydroelectric power accounted for nearly a third (31 percent). Wind was the source of 11 percent of total renewable energy consumption, and solar and geothermal combined contributed 5 percent.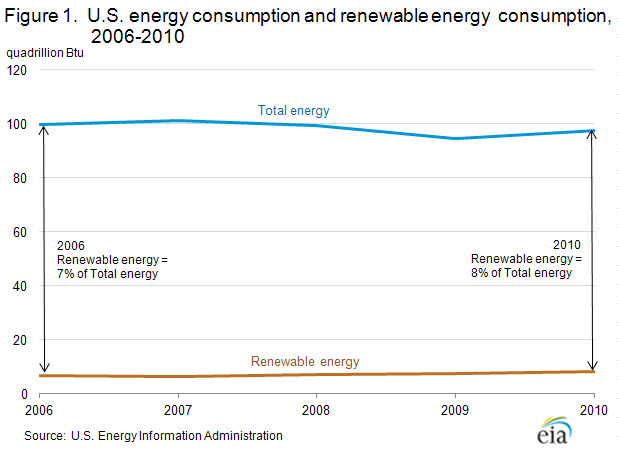
Total renewable energy consumption rose by 490 trillion Btu in 2010. Each of the renewable fuels, except hydroelectric power, contributed to this growth. Consumption of hydroelectric power fell by 130 trillion Btu. Biomass consumption grew by 382 trillion Btu (primarily due to increased ethanol consumption), accounting for the bulk of the increase in total renewable energy consumption. Wind energy consumption had the second largest increase, up by 202 trillion Btu. Smaller increases occurred in the consumption of solar energy and geothermal energy, amounting to 28 trillion Btu and 8 trillion Btu, respectively. Although solar energy contributed relatively little in terms of the absolute increase in total renewable energy consumption in 2010, solar energy use exhibited the highest rate of growth of all the renewable fuel categories.

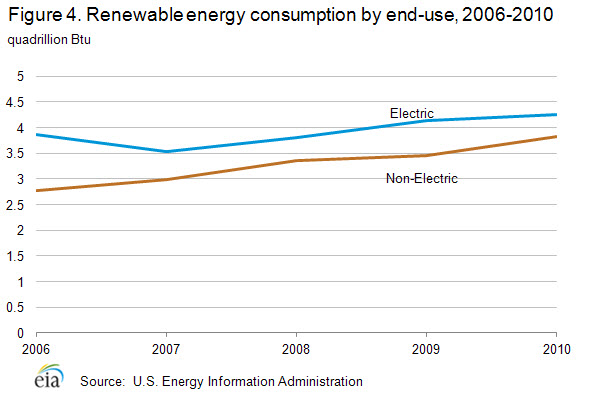
All end-use sectors exhibited increases in consumption of total renewable energy in 2010, but the electric power sector consumed the largest share. Electric power sector consumption accounted for about 50 percent of total renewable energy consumption, followed by the industrial sector, which accounted for 28 percent. Although hydroelectric power remains the dominant source of renewable energy consumption in the electric power sector, its market share has gradually declined over the last five years due to the precipitous increase in wind generation capacity coupled with relatively stagnant growth in hydroelectric generation capacity.
The transportation sector accounted for 13 percent of total renewable energy consumption in 2010, compared to 7 percent in 2006. Growth in biofuels (mainly ethanol) consumption has contributed to the transportation sector being the fastest-growing end-use sector in the last five years. Renewable energy consumption in the transportation sector has more than doubled between 2006 and 2010.