Alternative industrial sector outcomes in India:
India's energy use could be much higher
Release Date: 12/12/2019 | Full report | Webinar
Introduction
India is a developing economy with the world's fastest growing population and gross domestic product (GDP). As a result, long-term energy consumption projections are uncertain because of the rapid rate of change that is magnified by the size of the economy. This paper explores two aspects of uncertainty about India's future energy consumption: assumptions about economic composition and industrial sector energy intensity. It then shows that varying these assumptions can significantly increase estimates of future energy consumption.
Background
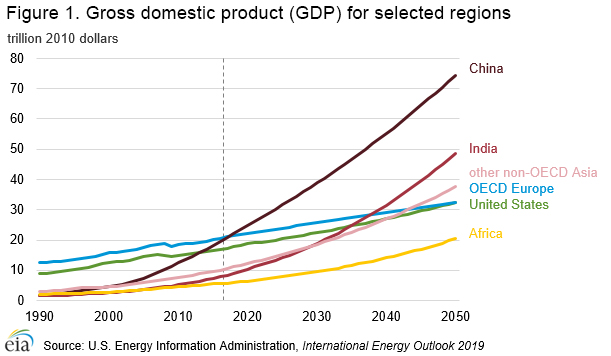
In our International Energy Outlook 2019 (IEO2019) Reference case, by 2050, the U.S. Energy Information Administration (EIA) projects that the economy of India will surpass the economies of the Organization for Economic Cooperation and Development (OECD) Europe and the United States to become the second-largest economy in the world (Figure 1). The Reference case shows India's GDP growing from $9 trillion[1] in 2018 to $49 trillion in 2050, an average growth of 5.4% per year. This growth rate significantly exceeds the global average annual growth rate of 3.0% in the IEO Reference case.
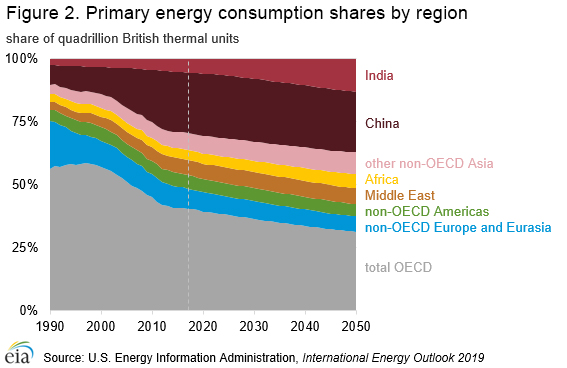
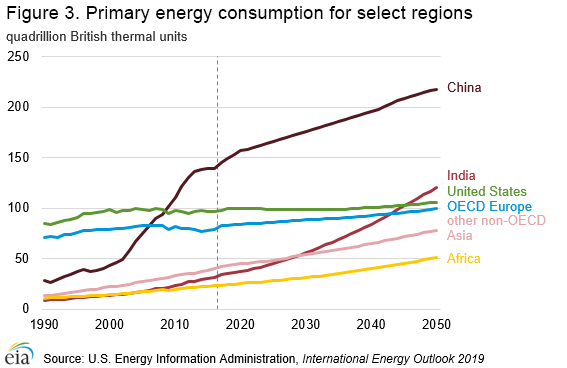
EIA projects that India will experience the fastest economic growth rate in the world, which will drive growth in India’s energy consumption. In the IEO Reference Case, India’s share of global energy use more than doubles from 5.7% in 2018 to 13.2% in 2050 (Figure 2). This increase corresponds to a total energy consumption increase from 35 quadrillion British thermal units (quads) to 120 quads (Figure 3).
Uncertainty: India's economic composition
India's economic output evolves along a distinct development path in the IEO Reference case. In this analysis, EIA separates economic output into the services[2] and industrial sectors, where the industrial sector can be further divided into manufacturing[3] and non-manufacturing[4]. Economic output can evolve as an economy matures. India is relatively balanced between economic sectors; it has generally equal shares of services, manufacturing, and non-manufacturing gross output in recent history. In the Reference case, India skips a possible development phase with a heavy manufacturing emphasis and instead pivots further toward services from the current even mix. The macroeconomic assumptions underlying our Reference case assume that India will not go through a period in which heavy manufacturing dominates the economy (Figure 4).
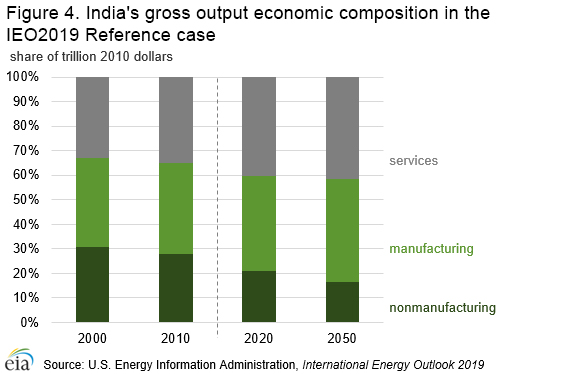
One potential source of uncertainty is if the Indian economy does not move to services as strongly as projected in the Reference case. It could instead slowly develop a greater manufacturing sector share through 2050. In general, a local manufacturing sector addresses people's needs for goods and can be leveraged as a foundation for developing more advanced jobs in the manufacturing sector.
Back to topUncertainty: India's industrial energy intensity
Beyond economic composition, the future operating characteristics of India's manufacturing and nonmanufacturing industrial sectors are uncertain. In the IEO2019 Reference case, the industrial sector in India operates at a relatively low energy intensity, measured in British thermal units (Btu) consumed per dollar of gross output (Figure 5). Known contributors to this lower energy intensity in India are a relatively high use of unreported, non-marketed energy sources[5], labor substitution reducing machine use of energy, and a less energy-intense industry composition.
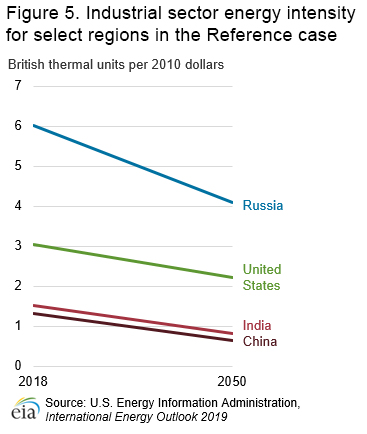
A transition to more marketed or recorded energy or a faster transition to machines from human labor would lead to higher reported energy intensities and energy consumption. These types of alternatives can be captured using general energy efficiency assumptions that differ from the IEO2019 Reference case.
Case analysis
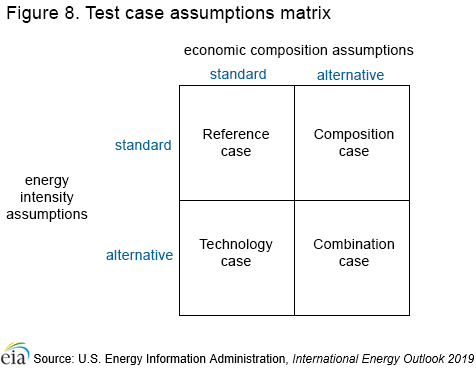
EIA analyzed three cases that varied assumptions to explore uncertainties related to India's industry composition and industrial energy intensities.
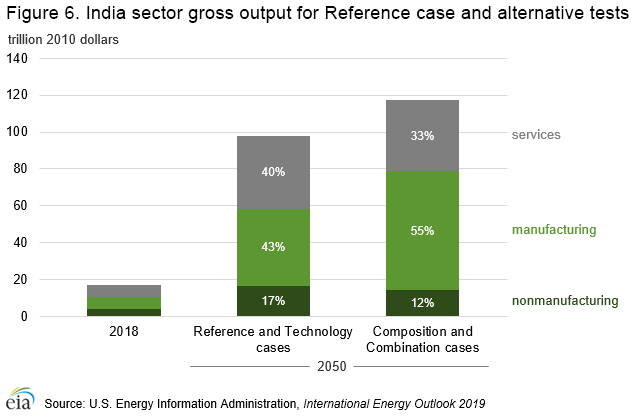
Composition case: In this case, India's economy tilts towards further growth in manufacturing, which increases energy consumption. This trend follows recent Indian government initiatives, such as “Make in India,”[6] that are designed to increase India's self-reliance for its own goods, and other initiatives that support increasing standards of living which raise demand for food products and household goods. Given these efforts, Indian manufacturing has a potential to grow more significantly than in the Reference case. India's manufacturing growth potential is addressed in this case (Figure 6).
EIA maintains the national-level economic growth used in the Reference case, but in this case EIA modifies India's projected production mix by increasing manufacturing growth. To produce a GDP-neutral outcome for higher manufacturing, the case exchanges manufacturing gross output[7] for reductions in the construction industry and services sector.
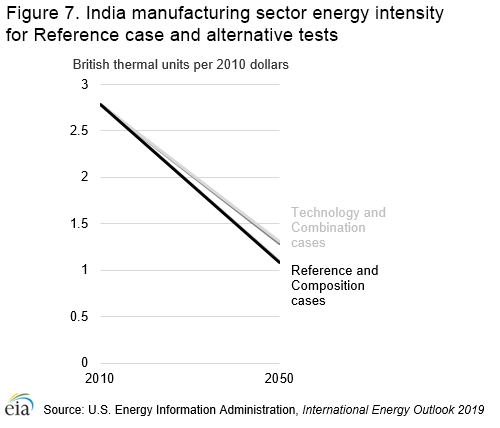
Technology case: In this case, India's industrial technology does not advance as quickly as in the IEO2019 Reference case—eliminating so-called technology leap-frogging—resulting in greater energy use in India. India's industrial energy use could rise more quickly than current estimates because of different paths of technology adoption, capital substitution for labor, and the addition of recorded energy use that was previously not explicit in national accounting.
This case indirectly simulates these changes by assuming that India's industrial sector will improve energy efficiency more slowly than the Reference case (Figure 7).
Combination case: This case combines the alternative assumptions in the Composition case and the Technology case (Figure 8). In this case, India's economy tilts towards further growth in manufacturing, and the industrial technology is less efficient than projected in the Reference case.
All cases keep assumptions on population, demographics, and global trade patterns aligned from the Reference case. Trade is allowed to grow, but it follows existing historic relationships. Fuel selection remains based on economics, and fuel switching is possible in the same way as the Reference case.
Results
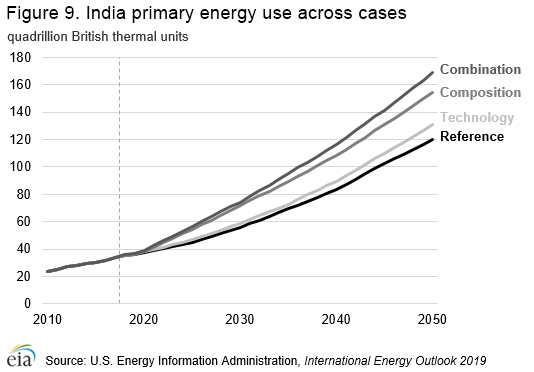
Compared with the Reference case, the smallest increase in global energy consumption is in the Technology case, demonstrating the greater effect that changing the composition of the economy has relative to changing the rate of technology improvement (Figure 9).
There are compound interactions that the alternative assumptions do not produce alone, and as a result, primary energy consumption increases the most in the Combination case (Figure 9). Total world primary energy use in 2050 increases 47 quads from the Reference case, with an increase of 50 quads in India. The increase in world total is lower than the increase in India because some economies—mostly in other emerging countries—reduce energy use slightly. The increase in manufacturing in India slightly reduces the need for manufacturing in other economies.
Growth in the industrial sector results in higher total energy consumption because the industrial sector has higher average energy intensity (Btu/dollar) than other sectors (Figure 10). Growth in energy consumption is also more pronounced in the Composition and Combination cases because of increased output within the manufacturing sector from industries with higher energy intensities, such as primary metals, non-metallic minerals, and chemicals.
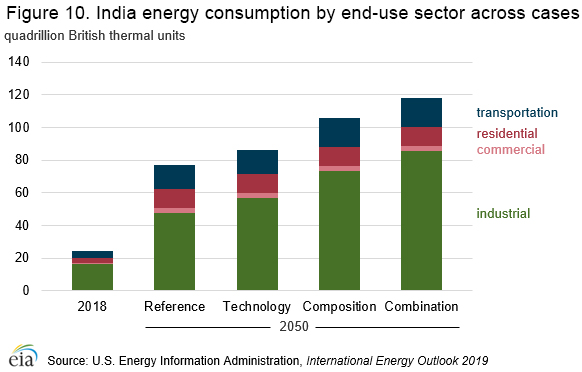
In these cases, EIA projects additional small changes in non-industrial sectors. The transportation sector consumption increases in these test cases primarily as a result of increases in the movement of goods produced by the industrial sector. In addition, although small, changes to the commercial sector reflect reductions in services output.
Each alternative case increases the energy consumption of India's industrial sector without explicitly changing analytic inputs to other regions, meaning India's share of global industrial sector energy demand increases as well (Figure 11).
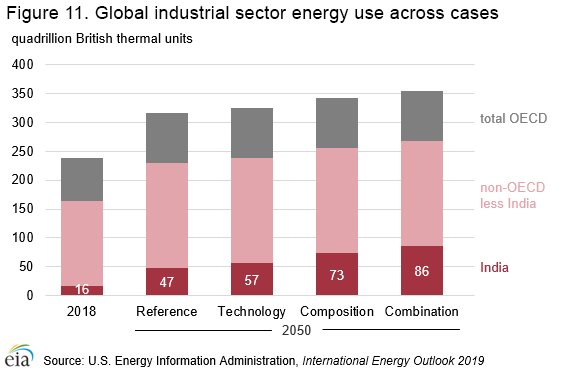
In the Technology case, India increases its industrial sector energy consumption the least–10 quads more than the Reference case in 2050–distributed relatively evenly across the industrial subsectors. This test case demonstrates that technology improvement has a smaller aggregate effect on energy use in this sector than which products are made. In the Composition and Combination cases, where the economic growth is more concentrated in manufacturing, India has a greater rise in energy use because those industries have higher energy intensities and therefore India takes a larger share of the global industrial sector total. The increase of 38 quads in India's industrial sector in 2050 for the Combination case is equivalent to adding more than 4% to global energy use in the Reference case.
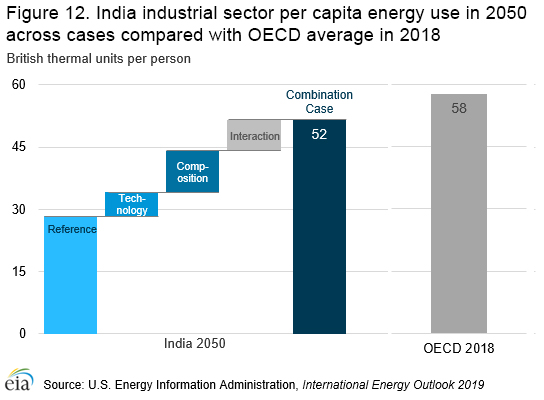
Per capita industrial delivered energy use in India increases in each of the cases (Figure 12). Compounding slower technology development with industrial composition shifted toward manufacturing, the Combination case, could in 2050 bring Indian industrial energy use to 52 Btu per person. On a per capita basis, this level is similar to the current OECD average.
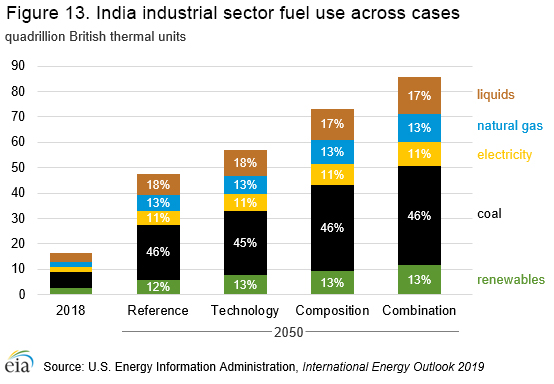
Within India's industrial sector, fuel shares remain consistent across all three of these cases in 2050 even with changes in industry composition toward manufacturing (Figure 13). Among industries that are heavy coal users, such as paper, cement, and steel makers, coal remains the preferred industrial fuel through the projection period with very little change in fuel shares despite rapid growth in those industries because coal is still relatively inexpensive. The chemical sector sees significant growth in liquids and natural gas use, but relative growth is stable, which keeps shares nearly constant as well.
In the two cases with increased manufacturing growth (Composition case and Combination Case), the addition to the sector does not target individual industries but instead allows the allocation of growth within the sector to happen according to the dynamics that drive the Reference case as well. The same is true for the reductions in the services sector. Interestingly, no single industry dominates India's industrial sector by the end of the projection period in any of the cases (Figure 14).
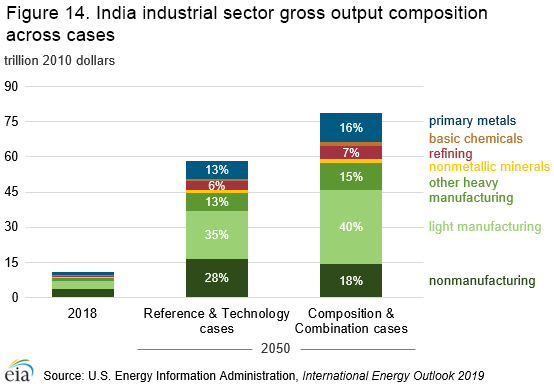
In the Composition and Combination cases, the nonmanufacturing sector, which includes the construction output that is explicitly reduced, decreases from 28% in 2050 in the Reference case to 18%. Light manufacturing—the least energy-intensive industries in the manufacturing sector—rises from 35% of industrial output in the Reference case to 40% in the Composition and Combination cases, and primary metals—one of the most-energy-intensive industries globally—is up from 13% in the Reference case to 16% in the Composition and Combination cases.
Back to topEndnotes
- All economic estimates are reported in 2010 U.S. dollars using purchasing power parity conversion.
- Services includes: retail and wholesale distribution, accommodation and catering, transport and storage, information and communications, financial services, business services, public administration, education, health care and social work, water, sewer, and electric utilities, and other services.
- Manufacturing is composed of two subsectors: energy-intensive (heavy) manufacturing and non-energy-intensive (light) manufacturing. Heavy manufacturing includes food products, paper products, basic chemicals, refining, primary metals, and nonmetallic minerals. Light manufacturing includes motorized vehicles (also called transportation equipment), metal-based durable equipment and machinery, other chemicals, and all other manufacturing industries.
- Nonmanufacturing is composed of agriculture, construction, and mining or extractive industries.
- Non-marketed energy sources include selected energy sources that are not bought or sold, either directly or indirectly, as an input to marketed energy—particularly, traditional fuels such as fuelwood, charcoal, agricultural waste, and animal dung used for cooking and water heating.
- See, for example, the discussion presented by the Prime Minister's office.
- The total gross output differs because gross output totals to GDP plus intermediate consumption. The intermediate consumption, defined as the total monetary value of goods and services consumed as inputs in production, differs between the cases; manufacturing requires greater intermediate consumption than services. Total GDP remains the same.