
Forecast overview
- Winter Fuels Outlook.We published the 2026–27 edition of the Winter Fuels Outlook in conjunction with this month’s Short-Term Energy Outlook (STEO). Nationally, we expect homes that use natural gas and propane as their main source of space heating—collectively around half of U.S. households—will spend less on average on those fuels than last winter. We forecast homes that use electricity as the main heating source will spend slightly more this winter. Fuel spending is set to rise the most for homes that primarily use heating oil, which make up about 3% of U.S. households and are located mostly in the Northeast part of the country. These homes face heating oil prices that are up more than 30% from last winter, although we expect heating oil expenditures to increase by 21%, offset by a milder winter this year in the Northeast. On average across the United States, our forecast assumes temperatures this winter will be about the same as last winter and the previous 10-winter average.
- Global oil market assumptions. Although we assume that oil flows from the Middle East will remain constrained through the fourth quarter of 2026 (4Q26), we estimate that regional shut-in production in September was the lowest since the onset of hostilities. Despite ongoing constraints, we assume that a combination of convoys through the Strait of Hormuz and workarounds to oil exports from the Middle East, including bypass routes and increased use of ship-to-ship transfers, will lead to production and exports from the region generally increasing through the forecast period.
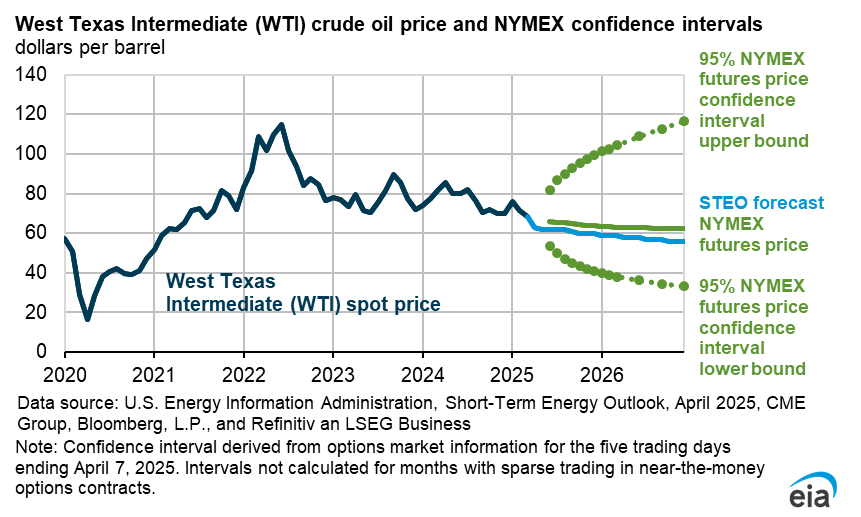
- Global oil prices. Although we expect oil production and flows from the Middle East will increase, we raised our global oil price forecast compared with last month. We now forecast the Brent crude oil spot price will average $105 per barrel (b) in 4Q26, $14/b higher than in last month’s STEO. The attacks on the East-West pipeline in Saudi Arabia highlight the potential for continued volatility in physical oil flows and oil prices amid ongoing withdrawals of oil inventories globally. Additional upward pressure on crude oil prices stems from extreme tightness in diesel markets that raises demand for crude oil in order for refiners to meet diesel demand. We expect the Brent spot price will fall to an average of $84/b next year.
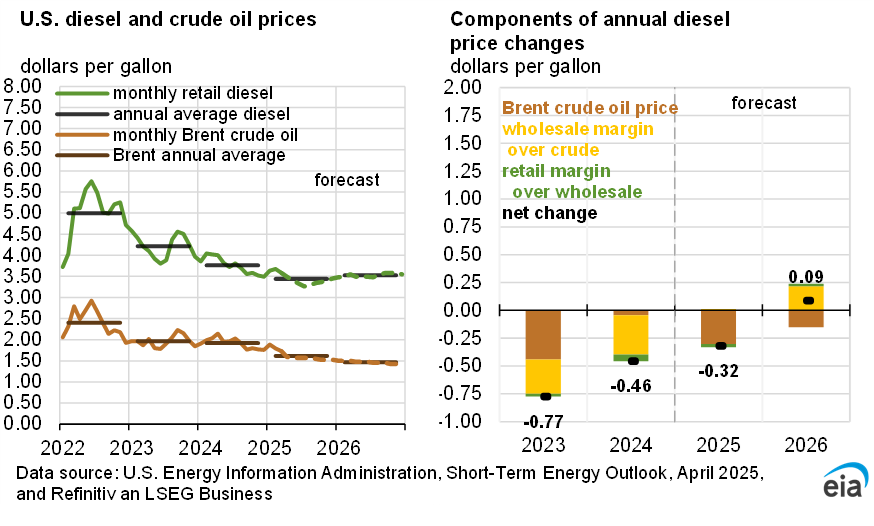
- Petroleum prices. U.S. retail gasoline and diesel prices rose sharply in September; gasoline prices averaged $4.35 per gallon (gal), and diesel prices averaged $6.29/gal, driven by higher crude oil prices and rising crack spreads. We expect retail diesel prices to average about $4.50/gal next year and for gasoline prices to average just under $3.60/gal.
- Distillate inventories. East Coast distillate fuel inventories fell 32% below their five-year seasonal average in September. Although we expect inventories to recover, they remain around 20% below the 2021–2025 average through the upcoming winter in our forecast. We expect ongoing global supply constraints will keep inventories below normal through the forecast period. We expect East Coast distillate inventories will gradually increase as the tightness in global fuel markets eases, bringing inventories in the region close to their five-year average during the second half of next year.
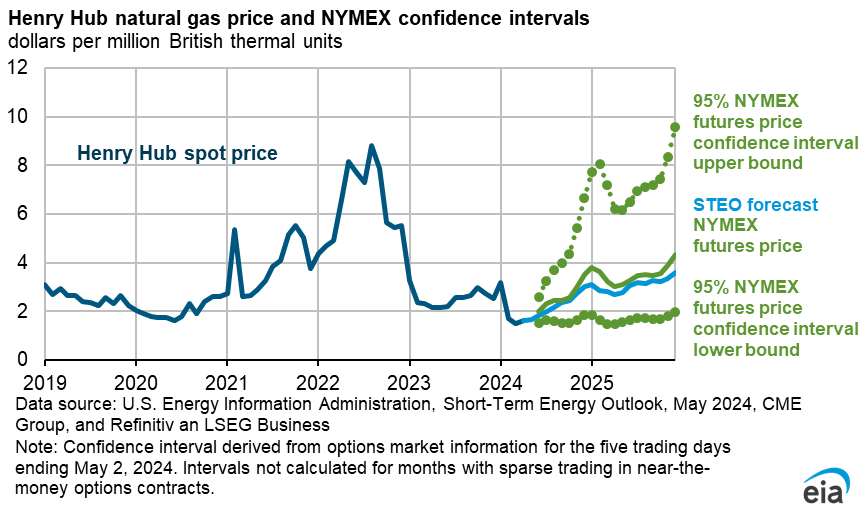
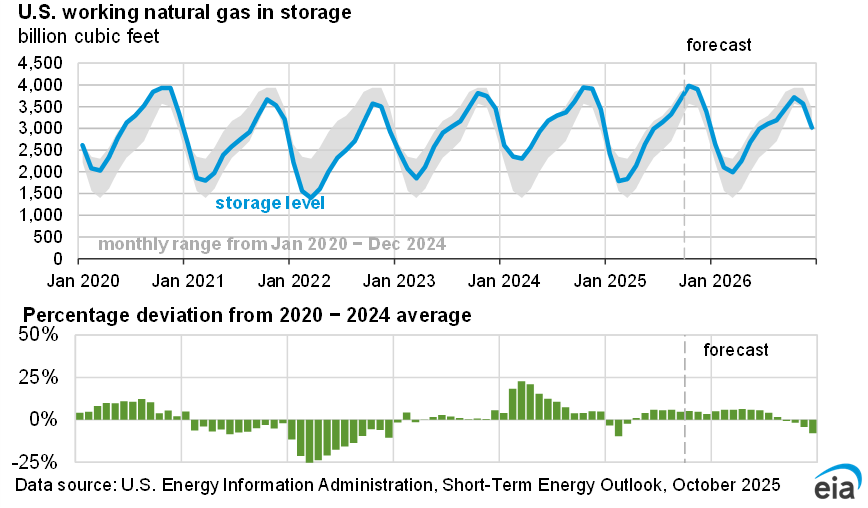
- Natural gas prices. We forecast the Henry Hub spot price for natural gas to average $3.16 per million British thermal units (MMBtu) in 2027, a 9% decrease from 2026. The decrease reflects ongoing higher-than-average natural gas inventories in our forecast, driven by production increases that offset rising liquefied natural gas exports.
- Wholesale electricity prices. Wholesale electricity prices in the United States average $52 per megawatt hour in 2026 in our forecast, 11% more than in 2025 primarily due to extreme weather events such as winter storm Fern and higher-than-average summer temperatures. Although prices across most hubs have remained relatively stable in 2026, wholesale prices in the PJM region are set to increase by 41% while prices in the Northwest Mid-Columbia region are expected to fall by 23%.
- Forecast timeline. We finalized inputs into the model on October 1, 2026. This month’s forecast does not specifically account for market events after that day. Accordingly, this outlook includes exchanges for 40 million barrels of crude oil from the U.S. Strategic Petroleum Reserve announced on September 29. However, it does not account for any additional crude oil or petroleum products on the market as a result of the G7's announcement on October 2.
| Notable Forecast Changes | 2026 | 2027 |
|---|---|---|
|
The current STEO forecast was released October 6. |
||
| Brent crude oil spot price (dollars per barrel) | $96 | $84 |
| Previous forecast | $91 | $74 |
| Percentage change | 6% | 14% |
| Retail diesel price (dollars per gallon) | $5.19 | $4.49 |
| Previous forecast | $5.07 | $4.40 |
| Percentage change | 2.4% | 2.0% |
| Retail gasoline price (dollars per gallon) | $3.91 | $3.56 |
| Previous forecast | $3.84 | $3.35 |
| Percentage change | 2.0% | 6.3% |
You can find more information in the detailed table of forecast changes.