|
Home >
Forecasts & Analyses > The National Energy Modeling System: An Overview > Introduction
|
The National Energy Modeling System: An Overview
|
Full Printer-Friendly Version |
|
Find on this page:
|
|
|
Introduction |
|
back to top |
The National Energy Modeling System (NEMS) is a computer-based, energy-economy
modeling system of U.S. through 2030. NEMS projects the production, imports,
conversion, consumption, and prices of energy, subject to assumptions on
macroeconomic and financial factors, world energy markets, resource availability
and costs, behavioral and technological choice criteria, cost and performance
characteristics of energy technologies, and demographics. NEMS was designed
and implemented by the Energy Information Administration (EIA) of the U.S.
Department of Energy (DOE).
The National Energy Modeling System: An Overview 2009 provides an overview
of the structure and methodology of NEMS and each of its components. This
chapter provides a description of the design and objectives of the system,
followed by a chapter on the overall modeling structure and solution algorithm.
The remainder of the report summarizes the methodology and scope of the
component modules of NEMS. The model descriptions are intended for readers
familiar with terminology from economic, operations research, and energy
modeling. More detailed model documentation reports for all the NEMS modules
are also available from EIA (Appendix, “Bibliography”). |
|
|
|
| Purpose of NEMS |
|
back to top |
NEMS is used by EIA to project the energy, economic, environmental, and
security impacts on the United States of alternative energy policies and
different assumptions about energy markets. The projection horizon is approximately
25 years into the future. The projections in Annual Energy Outlook 2009
(AEO2009) are from the present through 2030. This time period is one in
which technology, demographics, and economic conditions are sufficiently
understood in order to represent energy markets with a reasonable degree
of confidence. NEMS provides a consistent framework for representing the
complex interactions of the U.S. energy system and its response to a wide
variety of alternative assumptions and policies or policy initiatives.
As an annual model, NEMS can also be used to examine the impact of new
energy programs and policies.
Energy resources and prices, the demand for specific energy services, and
other characteristics of energy markets vary widely across the United States.
To address these differences, NEMS is a regional model. The regional disaggregation
for each module reflects the availability of data, the regional format
typically used to analyze trends in the specific area, geology, and other
factors, as well as the regions determined to be the most useful for policy
analysis. For example, the demand modules (e.g., residential, commercial,
industrial and transportation) use the nine Census divisions, the Electricity
Market Module uses 15 supply regions based on the North American Electric
Reliability Council (NERC) regions, the Oil and Gas Supply Modules use
12 supply regions, including 3 offshore and 3 Alaskan regions, and the
Petroleum Market Module uses 5 regions based on the Petroleum Administration
for Defense Districts.
Baseline projections are developed with NEMS and published annually in
the Annual Energy Outlook (AEO). In accordance with the requirement that
EIA remain policy-neutral, the AEO projections are generally based on Federal,
State, and local laws and regulations in affect at the time of the projection.
The potential impacts of pending or proposed legislation, regulations,
and standards¾or of sections of legislation that have been enacted but
that require implementing regulations or appropriations of funds that have
not been provided or specified in the legislation itself¾are not reflected
in NEMS. The first version of NEMS, completed in December 1993, was used
to develop the projections presented in the Annual Energy Outlook 1994.
This report describes the version of NEMS used for the AEO2009.1
The projections produced by NEMS are not considered to be statements of
what will happen but of what might happen, given the assumptions and methodologies
used. Assumptions include, for example, the estimated size of the economically
recoverable resource base of fossil fuels, and changes in world energy
supply and demand. The projections are business-as-usual trend estimates,
given known technological and demographic trends. |
|
|
|
| Analytical Capability |
|
back to top |
NEMS can be used to analyze the effects of existing and proposed government
laws and regulations related to energy production and use; the potential
impact of new and advanced energy production, conversion, and consumption
technologies; the impact and cost of greenhouse gas control; the impact
of increased use of renewable energy sources; and the potential savings
from increased efficiency of energy use; and the impact of regulations
on the use of alternative or reformulated fuels.
In addition to producing the analyses in the AEO, NEMS is used for one-time
analytical reports and papers, such as An Updated Annual Energy Outlook
2009 Reference Case Reflecting Provisions of the American Recovery and
Reinvestment Act and Recent Changes in the Economic Outlook,2 which updates
the AEO2009 reference case to reflect the enactment of the American Recovery
and Reinvestment Act in February 2009 and to adopt a revised macroeconomic
outlook for the U.S. and global economies. The revised AEO2009 reference
case will be used as the starting point for pending and future analyses
of proposed energy and environmental legislation. Other analytical papers,
which either describe the assumptions and methodology of the NEMS or look
at current energy markets issues, are prepared using the NEMS. Many of
these papers are published in the Issues In Focus section of the AEO.
Past and current analyses are available at http://www.eia.doe.gov/oiaf/aeo/otheranalysis/
aeo_analyes.html.
NEMS has also been used for a number of special analyses at the request
of the Administration, U.S. Congress, other offices of DOE and other government
agencies, who specify the scenarios and assumptions for the analysis. Some
recent examples include: |
- Energy Market and Economic Impacts of H.R. 2454, the American Clean Energy
and Security Act of 2009,3 requested by Chairman Henry Waxman and Chairman
Edward Markey to analyze the impacts of H.R. 2454, the American Clean Energy
and Security Act of 2009 (ACESA), which was passed by the House of Representatives
on June 26, 2009. ACESA is a complex bill that regulates emissions of
greenhouse gases through market-based mechanisms, efficiency programs,
and economic incentives.
- Impacts of a 25-Percent Renewable Electricity Standard as Proposed in the
American Clean Energy and Security Act,4 requested by Senator Markey to
analyze the effects of a 25-percent Federal renewable electricity standard
(RES) as included in the discussion draft of broader legislation, the American
Clean Energy and Security Act.
- Light-Duty Diesel Vehicles: Efficiency and Emissions Attributes and Market
Issues,5 requested by Senator Sessions to analyze the environmental and
energy efficiency attributes of diesel-fueled light-duty vehicles (LDV’s),
including comparison of the characteristics of the vehicles with those
of similar gasoline-fueled, E85-fueled, and hybrid vehicles, as well as
a discussion of any technical, economic, regulatory, or other obstacles
to increasing the use of diesel-fueled vehicles in the United States.
- The Impact of Increased Use of Hydrogen on Petroleum Consumption and Carbon
Dioxide Emissions,6 requested by Senator Dorgan to analyze the impacts
on U.S. energy import dependence and emissions reductions resulting from
the commercialization of advanced hydrogen and fuel cell technologies in
the transportation and distributed generation markets.
- Analysis of Crude Oil Production in the Arctic National Wildlife Refuge,7 requested by Senator Stevens to access the impact of Federal oil and natural
gas leasing in the coastal plain of the Arctic National Wildlife Refuge
in Alaska.
- Energy Market and Economic Impacts of S.2191, the Lieberman-Warner Climate
Security Act of 2007,8 requested by Senators Lieberman, Warner, Inhofe,
Voinovich, and Barrasso to analyze the impacts of the greenhouse gas cap-and-trade
program that would be established under Title I of S.2191.
- Energy Market and Economic Impacts of S.1766, the Low Carbon Economy Act
of 2007,9 requested by Senators Bingaman and Specter to analyze the impact
of the mandatory greenhouse gas allowance program under S.1766 designed
to maintain covered emissions at approximately 2006 levels in 2020, 1990
levels in 2030, and at least 60 percent below 1990 levels by 2050.
|
|
|
|
| Representations of Energy Market Interactions |
|
back to top |
NEMS is designed to represent the important interactions of supply and
demand in U.S. energy markets. In the United States, energy markets are
driven primarily by the fundamental economic interactions of supply and
demand. Government regulations and policies can exert considerable influence,
but the majority of decisions affecting fuel prices and consumption patterns,
resource allocation, and energy technologies are made by private individuals
who value attributes other than life cycle costs or companies attempting
to optimize their own economic interests. NEMS represents the market behavior
of the producers and consumers of energy at a level of detail that is useful
for analyzing the implications of technological improvements and policy
initiatives.
Energy Supply/Conversion/Demand Interactions
NEMS is a modular system. Four end-use demand modules represent fuel consumption
in the residential, commercial, transportation, and industrial sectors,
subject to delivered fuel prices, macroeconomic influences, and technology
characteristics. The primary fuel supply and conversion modules compute
the levels of domestic production, imports, transportation costs, and fuel
prices that are needed to meet domestic and export demands for energy,
subject to resource base characteristics, industry infrastructure and technology,
and world market conditions. The modules interact to solve for the economic
supply and demand balance for each fuel. Because of the modular design,
each sector can be represented with the methodology and the level of detail,
including regional detail, appropriate for that sector. The modularity
also facilitates the analysis, maintenance, and testing of the NEMS component
modules in the multi-user environment.
Domestic Energy System/Economy Interactions
The general level of economic activity, represented by gross domestic product,
has traditionally been used as a key explanatory variable or driver for
projections of energy consumption at the sectoral and regional levels.
In turn, energy prices and other energy system activities influence economic
growth and activity. NEMS captures this feedback between the domestic economy
and the energy system. Thus, changes in energy prices affect the key macroeconomic
variables—such as gross domestic product, disposable personal income, industrial
output, housing starts, employment, and interest rates—that drive energy
consumption and capacity expansion decisions.
Domestic/World Energy Market Interactions
World oil prices play a key role in domestic energy supply and demand decision
making and oil price assumptions are a typical starting point for energy
system projections. The level of oil production and consumption in the
U.S. energy system also has a significant influence on world oil markets
and prices. In NEMS, an international module represents the response of
world oil markets (supply and demand) to assumed world oil prices. The
results/outputs of the module are international liquids consumption and
production by region, and a crude oil supply curve representing international
crude oil similar in quality to West Texas Intermediate that is available
to U.S. markets through the Petroleum Market Module (PMM) of NEMS. The
supply-curve calculations are based on historical market data and a world
oil supply/demand balance, which is developed from reduced-form models
of international liquids supply and demand, current investment trends in
exploration and development, and long-term resource economics for 221 countries/territories.
The oil production estimates include both conventional and unconventional
supply recovery technologies.
Economic Decision Making Over Time
The production and consumption of energy products today are influenced
by past investment decisions to develop energy resources and acquire energy-using
capital stock. Similarly, the production and consumption of energy in a
future time period will be influenced by decisions made today and in the
past.
Current investment decisions depend on expectations about future markets.
For example, expectations of rising energy prices in the future increase
the likelihood of current decisions to invest in more energy-efficient
technologies or alternative energy sources. A variety of assumptions about
planning horizons, the formation of expectations about the future, and
the role of those expectations in economic decision making are applied
within the individual NEMS modules. |
|
|
| Technology Representation |
|
back to top |
A key feature of NEMS is the representation of technology and technology
improvement over time. Five of the sectors—residential, commercial, transportation,
electricity generation, and refining—include extensive treatment of individual
technologies and their characteristics, such as the initial capital cost,
operating cost, date of availability, efficiency, and other characteristics
specific to the particular technology. For example, technological progress
in lighting technologies results in a gradual reduction in cost and is
modeled as a function of time in these end-use sectors. In addition, the
electricity sector accounts for technological optimism in the capital costs
of first-of-a-kind generating technologies and for a decline in cost as
experience with the technologies is gained both domestically and internationally.
In each of these sectors, equipment choices are made for individual technologies
as new equipment is needed to meet growing demand for energy services or
to replace retired equipment.
In the other sectors—industrial, oil and gas supply, and coal supply—the
treatment of technologies is more limited due to a lack of data on individual
technologies. In the industrial sector, only the combined heat and power
and motor technologies are explicitly considered and characterized. Cost
reductions resulting from technological progress in combined heat and power
technologies are represented as a function of time as experience with the
technologies grows. Technological progress is not explicitly modeled for
the industrial motor technologies. Other technologies in the energy-intensive
industries are represented by technology bundles, with technology possibility
curves representing efficiency improvement over time. In the oil and gas
supply sector, technological progress is represented by econometrically
estimated improvements in finding rates, success rates, and costs. Productivity
improvements over time represent technological progress in coal production. |
|
|
| External Availability |
|
back to top |
In accordance with EIA requirements, NEMS is fully documented and archived.
EIA has been running NEMS on four EIA terminal servers and several dual-processor
personal computers (PCs) using the Windows XP operating system. The archive
file provides the source language, input files, and output files to replicate
the Annual Energy Outlook reference case runs on an identically equipped
computer; however, it does not include the proprietary portions of the
model, such as the IHS Global Insight, Inc. (formerly DRI-WEFA) macroeconomic
model and the optimization modeling libraries. NEMS can be run on a high-powered
individual PC as long as the required proprietary software resides on the
PC. Because of the complexity of NEMS, and the relatively high cost of
the proprietary software, NEMS is not widely used outside of the Department
of Energy. However, NEMS, or portions of it, is installed at the Lawrence
Berkeley National Laboratory, Oak Ridge National Laboratory, the Electric
Power Research Institute, the National Energy Technology Laboratory, the
National Renewable Energy Laboratory, several private consulting firms,
and a few universities. |
|
|
| Overview of NEMS |
|
back to top |
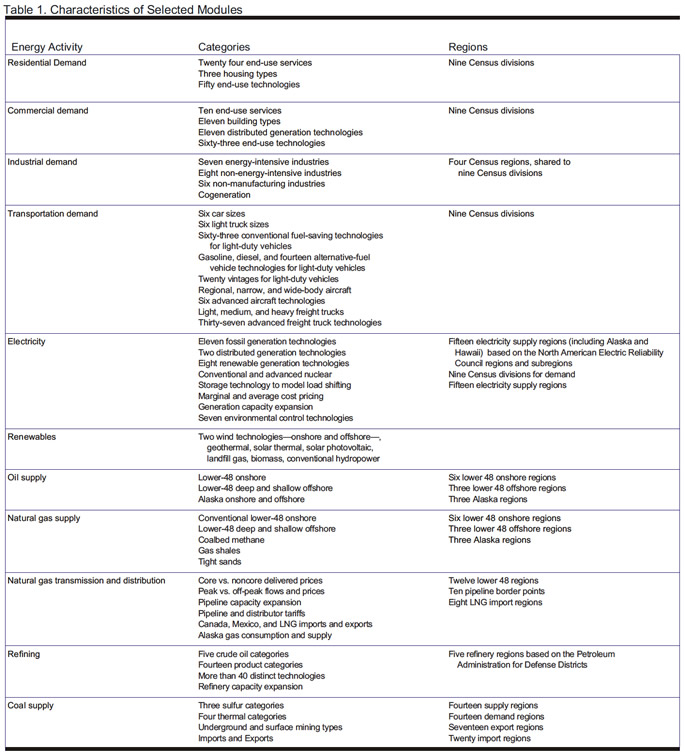
NEMS explicitly represents domestic energy markets by the economic decision
making involved in the production, conversion, and consumption of energy
products. Where possible, NEMS includes explicit representation of energy
technologies and their characteristics. Since energy costs, availability,
and energy-consuming characteristics vary widely across regions, considerable
regional detail is included. Other details of production and consumption
are represented to facilitate policy analysis and ensure the validity of
the results. A summary of the detail provided in NEMS is shown in Table
1 below. |
|
|
|
| Major Assumptions |
|
back to top |
Each module of NEMS embodies many assumptions and data to characterize
the future production, conversion, or consumption of energy in the United
States. Two of the more important factors influencing energy markets are
economic growth and oil prices.
The AEO2009 includes five primary fully-integrated cases: a reference
case, high and low economic growth cases, and high and low oil price cases.
The primary determinant for different economic growth rates are assumptions
about growth in the labor force and productivity, while the long-term oil
price paths are based on access to and cost of oil from the non-Organization
of Petroleum Exporting Countries (OPEC), OPEC supply decisions, and
the supply potential of unconventional liquids, as well as the demand for
liquids.
In addition to the five primary fully-integrated cases, AEO2009 includes
34 other cases that explore the impact of varying key assumptions in the
individual components of NEMS. Many of these cases involve changes in the
assumptions that impact the penetration of new or improved technologies,
which is a major uncertainty in formulating projections of future energy
markets. Some of these cases are run as fully integrated cases (e.g., integrated
2009 technology case, integrated high technology case, low and high renewables
technology cost cases, slow and rapid oil and gas technology cases, and
low and high coal cost cases). Others exploit the modular structure of
NEMS by running only a portion of the entire modeling system in order to
focus on the first-order impacts of changes in the assumptions (e.g., 2009,
high, and best available technology cases in the residential and commercial
sectors, 2009 and high technology cases in the industrial sector and, low
and high technology cases in the transportation sector). |
|
|
|
| NEMS Modular Structure |
|
back to top |
Overall, NEMS represents the behavior of energy markets and their interactions
with the U.S. economy. The model achieves a supply/demand balance in the
end-use demand regions, defined as the nine Census divisions (Figure 1),
by solving for the prices of each energy type that will balance the quantities
producers are willing to supply with the quantities consumers wish to consume.
The system reflects market economics, industry structure, and existing
energy policies and regulations that influence market behavior.
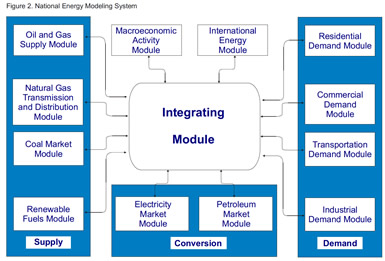
NEMS consists of four supply modules (oil and gas, natural gas transmission
and distribution, coal market, and renewable fuels); two conversion modules
(electricity market and petroleum market); four end-use demand modules
(residential demand, commercial demand, industrial demand, and transportation
demand); one module to simulate energy/economy interactions (macroeconomic
activity); one module to simulate international energy markets (international
energy); and one module that provides the mechanism to achieve a general
market equilibrium among all the other modules (integrating module). Figure
2 depicts the high-level structure of NEMS.
Because energy markets are heterogeneous, a single methodology does not
adequately represent all supply, conversion, and end-use demand sectors.
The modularity of the NEMS design provides the flexibility for each component
of the U.S. energy system to use the methodology and coverage that is most
appropriate. Furthermore, modularity provides the capability to execute
the modules individually or in collections of modules, which facilitates
the development and analysis of the separate component modules. The interactions
among these modules are controlled by the integrating module.
The NEMS global data structure is used to coordinate and communicate the
flow of information among the modules. These data are passed through common
interfaces via the integrating module. The global data structure includes
energy market prices and consumption; macroeconomic variables; energy production,
transportation, and conversion information; and centralized model control
variables, parameters, and assumptions. The global data structure excludes
variables that are defined locally within the modules and are not communicated
to other modules.
A key subset of the variables in the global data structure is the end-use
prices and quantities of fuels that are used to equilibrate the NEMS energy
balance in the convergence algorithm. These delivered prices of energy
and the quantities demanded are defined by product, region, and sector.
The delivered prices of fuel encompass all the activities necessary to
produce, import, and transport fuels to the end user. The regions used
for the price and quantity variables in the global data structure are the
nine Census divisions. The four Census regions (shown in Figure 1 by breaks
between State groups) and nine Census divisions are a common, mainstream
level of regionality widely used by EIA and other organizations for data
collection and analysis. |
|
|
Click for a larger version
Click for a larger version |
| Integrating Module |
|
back to top |
The NEMS integrating module controls the entire NEMS solution process as
it iterates to determine a general market equilibrium across all the NEMS
modules. It has the following functions:
- Manages the NEMS global data structure
- Executes all or any of the user-selected modules in an iterative
convergence algorithm
- Checks for convergence and reports variables that remain out of convergence
- Implements convergence relaxation on selected variables between iterations
to accelerate convergence
- Updates expected values of the key NEMS variables.
The integrating module executes the demand, conversion, and supply modules
iteratively until it achieves an economic equilibrium of supply and demand
in all the consuming and producing sectors. Each module is called in sequence
and solved, assuming that all other variables in the energy markets are
fixed. The modules are called iteratively until the end-use prices and
quantities remain constant within a specified tolerance, a condition defined
as convergence. Equilibration is achieved annually throughout the projection
period, currently through 2030, for each of the nine Census divisions.
In addition, the macroeconomic activity and international energy modules
are executed iteratively to incorporate the feedback on the economy and
international energy markets from changes in the domestic energy markets.
Convergence tests check the stability of a set of key macroeconomic and
international trade variables in response to interactions with the domestic
energy system.
The NEMS algorithm executes the system of modules until convergence is
reached. The solution procedure for one iteration involves the execution
of all the component modules, as well as the updating of expectation variables
(related to foresight assumptions) for use in the next iteration. The system
is executed sequentially for each year in the projection period. During
each iteration, the modules are executed in turn, with intervening convergence
checks that isolate specific modules that are not converging. A convergence
check is made for each price and quantity variable to see whether the percentage
change in the variable is within the assumed tolerance. To avoid unnecessary
iterations for changes in insignificant values, the quantity convergence
check is omitted for quantities less than a user-specified minimum level.
The order of execution of the modules may affect the rate of convergence
but will generally not prevent convergence to an equilibrium solution or
significantly alter the results. An optional relaxation routine can be
executed to dampen swings in solution values between iterations. With
this option, the current iteration values are reset partway between solution
values from the current and previous iterations. Because of the modular
structure of NEMS and the iterative solution algorithm, any single module
or subset of modules can be executed independently. Modules not executed
are bypassed in the calling sequence, and the values they would calculate
and provide to the other modules are held fixed at the values in the global
data structure, which are the solution values from a previous run of NEMS.
This flexibility is an aid to independent development, debugging, and analysis. |
|
|
| |
|
|
Preface/Contacts
Appendix
Notes and Sources |
|
|
|
|