
The world’s largest nuclear plants differ by age, number of reactors, and utilization
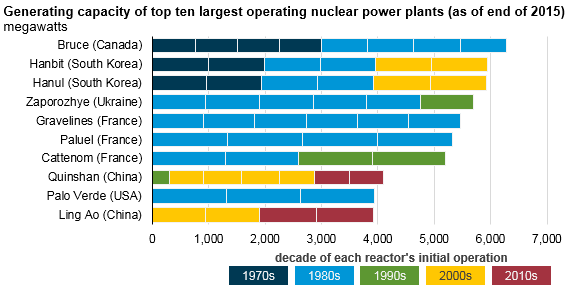
There are currently 449 operating nuclear reactors in 31 countries, with a total installed generating capacity of more than 390,000 megawatts (MW), based on data from the International Atomic Energy Agency. Nuclear power plants differ in various ways including reactor types, vessel containments, cooling methods, and dispatch purposes. The largest nuclear plant in the United States, the Palo Verde plant near Phoenix, Arizona, ranks as the ninth-largest operating nuclear plant in the world and has the highest capacity factor among large nuclear plants.
The list of the largest nuclear plants has changed in recent years. Three plants in Japan, each with a generating capacity of more than 4,000 MW, were suspended from operation following the accident at Fukushima Daiichi and, like nearly all of Japan’s existing nuclear plants, are not currently generating electricity. Other countries, especially China, are adding large nuclear plants. For instance, the Hongyanhe plant near Dalian, China, had a capacity of 3,183 MW at the end of 2015 but, with the startup of another 1,000 MW reactor in 2016, the plant's capacity now totals 4,183 MW, with another two reactors under construction.
With the idling of Japan’s 7,965 MW Kashiwazaki-Kariwa plant, the Bruce Nuclear Generating Station, located on Lake Huron in Ontario, Canada, is currently the world’s largest operating nuclear power plant. Bruce has eight reactors, configured as two separate facilities operating four reactor units each, and has a combined installed capacity of 6,274 MW.
Of the top ten operating nuclear plants in the world, the United States’ Palo Verde plant has the fewest number of reactors (three) but has the highest capacity factor, a measure of plant utilization. Plants that operate more have higher capacity factors and produce more electricity per unit of generating capacity. Based on the most recent five years of data (2011–15), Palo Verde’s capacity factor averaged 92%, while other large nuclear plants’ capacity factors ranged from 73% to 88%.
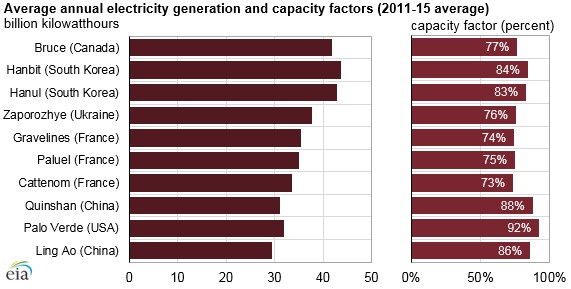
Over the past 15 years, nuclear capacity factors in the United States have typically remained above 90%, which is higher than nuclear plants in other regions of the world. The duration of refueling and maintenance outages is a significant factor in why U.S. capacity factors are so high. Nuclear reactors undergo routine maintenance and refueling outages about once every 18 to 24 months. Although a nuclear reactor can be refueled in as little as 10 days, outages often last longer, as operators conduct other noncritical maintenance work simultaneously to minimize overall operational downtime.
In the United States, the average duration of refueling outages has been steadily declining. In the early 1990s, refueling-related outages lasted nearly three months. In spring 2016, refueling outages in the United States averaged 29 days. Using data from the Nuclear Regulatory Commission, EIA maintains a tool displaying the daily operating status of each nuclear plant in the United States.
Principal contributor: Slade Johnson
Tags: electricity, generation, international, nuclear