
U.S. oil drilling increasingly focused in Permian Basin
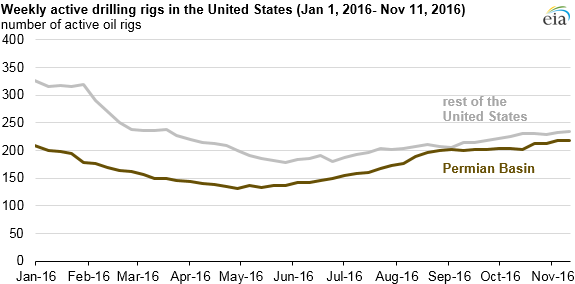
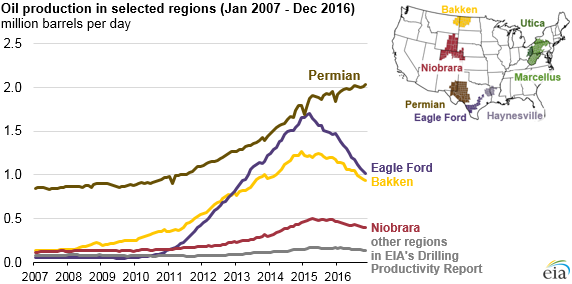
U.S. drilling activity is increasingly concentrated in the Permian Basin, which spans parts of western Texas and southeastern New Mexico. The Permian now holds nearly as many active oil rigs as the rest of the United States combined, including both onshore and offshore rigs, and it is the only region in EIA’s Drilling Productivity Report where crude oil production is expected to increase for the third consecutive month.
Exploration and production companies are increasing merger and acquisition (M&A) spending in the United States, recovering from a low period of M&A spending in 2015 and the first quarter of 2016. This change is attributed to two key factors. First, weekly average West Texas Intermediate crude oil spot prices averaged between $40 per barrel (b) and $50/b since mid-April, an increase from prices averaging near $30/b in the first quarter of 2016. Second, improved credit conditions, as reflected in lower spreads in the yields between energy bonds and U.S. Treasury bonds, suggest improved investor sentiment in the U.S. upstream oil sector. Several of the larger M&A deals involved Permian Basin assets, where drilling and production is beginning to increase.
Based on data through November 10, the second half of 2016 already has more M&A spending than the first half of 2016, but on fewer deals. The 93 M&A announcements in the third quarter of 2016 totaled $16.6 billion, for an average of $179 million per deal, the largest per deal average since the third quarter of 2014. Although only 11 of the 49 deals so far in the fourth quarter of 2016 are in the Permian Basin, they accounted for more than half of total deal value.
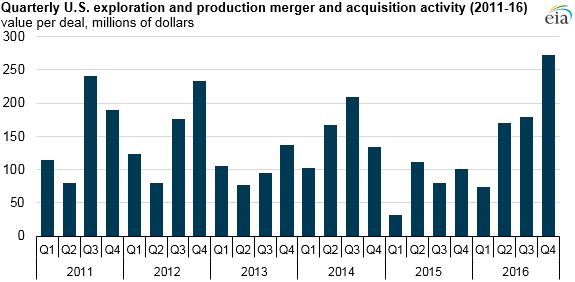
Note: Fourth-quarter 2016 data represent data through November 10. Graph shows exploration and production merger and acquisition announcement spending in the United States.
Merger and acquisition activity includes the sale of assets from one entity to another, which does not necessarily lead to an increase in exploration investment or production. A company may engage in M&A to diversify its portfolio or to position itself for future opportunities. Another company may sell property to increase liquid assets on its balance sheet. Continued increases in the U.S. rig count, however, suggest companies are beginning to invest capital in development projects.
Continued investment could lead to an increase in crude oil production in the Lower 48 states, which has been declining since April 2015. EIA’s most recent Short-Term Energy Outlook (STEO) forecasts that production will increase in the second quarter of 2017. However, this production forecast is predicated on the expected price of West Texas Intermediate crude oil, which is highly uncertain. Significant divergence of actual prices from the projected path could change the pace of drilling new wells, which would, in turn, affect the production forecast.
Principal contributor: Jeff Barron