
World tight oil production to more than double from 2015 to 2040
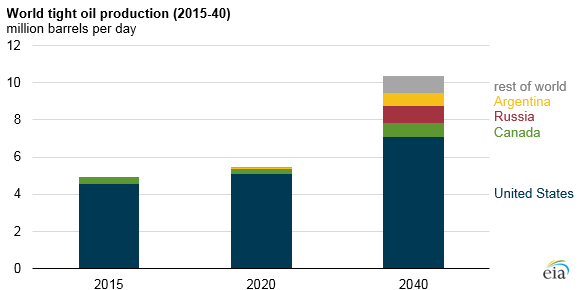
World tight oil production is expected to more than double between 2015 and 2040, increasing from 4.98 million barrels per day (b/d) in 2015 to 10.36 million b/d in 2040, according to the U.S. Energy Information Administration's International Energy Outlook 2016 (IEO2016) and Annual Energy Outlook 2016 (AEO2016). Most of the projected increase will come from the United States, with much of the rest coming from countries such as Russia, Canada, and Argentina that have significant tight oil resources and existing, developed oil industries.
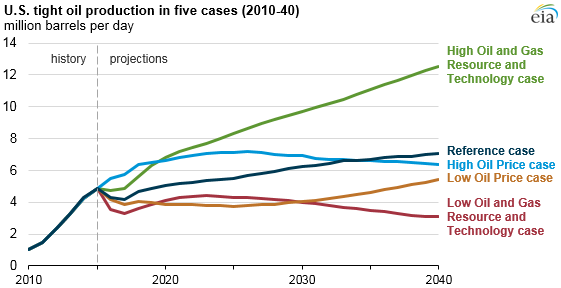
United States tight oil production, which reached 4.6 million b/d in March 2015 but fell to 4.1 million b/d in June 2016, has proven more resilient to low oil prices than many analysts had anticipated. U.S. tight oil production is expected to reach 7.1 million b/d in 2040 in the AEO2016 Reference case.
Other AEO2016 side cases that have different assumptions than the Reference case about oil prices, technological advances, and resource availability have different projected levels of tight oil production. Two oil price side cases illustrate the effects of higher or lower global crude oil prices. By 2040, the global benchmark Brent crude oil spot price averages $73/b in the Low Oil Price case, $136/b in the Reference case, and $230/b in the High Oil Price case. In the High Oil Price case, drilling activities increase cumulative production. The opposite is true in the Low Oil Price case, where production decreases in response to low prices.
In the resource and technology side cases, the estimated ultimate recovery for tight oil wells in the United States is 50% higher or 50% lower than in the Reference case. Rates of technological improvement that reduce costs and increase productivity in the United States are also 50% higher or 50% lower than in the Reference case. By 2040, these cases result in the largest differences from Reference case production values.
Canada's tight oil production, which reached 0.45 million b/d in December 2014, declined in January 2016 to 0.36 million b/d, based on the latest available data from the Canada National Energy Board. Average year-on-year growth of tight oil production has been declining since 2012, mainly because of competition with oil sands development for capital. Oil sands development tends to have larger resource bases than the known shale/tight oil resources. IEO2016 projects that tight oil production in Canada will continue to decline until 2020, and then increase over the rest of the projection period, reaching 0.76 million b/d in 2040 in response to higher crude oil prices and less competition for capital with oil sands development.
Argentina is still in the early stages of commercial tight oil production. The Argentine national oil company, Yacimientos Petrolíferos Fiscales, reported that shale production reached 0.05 million barrels of oil equivalent per day (of which 0.03 million b/d was estimated to be tight oil) in the fourth quarter of 2015 from its joint venture with Chevron in Neuquén Basin, Argentina. IEO2016 projects that production will double from 2015 to 2020 and will reach 0.69 million b/d in 2040.
Russia, Mexico, Colombia, Australia, and other countries that hold large technically recoverable tight oil resources had not yet reached commercial production of tight oil in 2015. As oil prices increase after 2020, they are expected to contribute 18% (or the combined equivalent of 1.8 million b/d) of the projected total world tight oil production of 10.36 million b/d by 2040.
Principal contributor: Faouzi Aloulou