Oil and natural gas production jobs in May were 26% lower than in October 2014
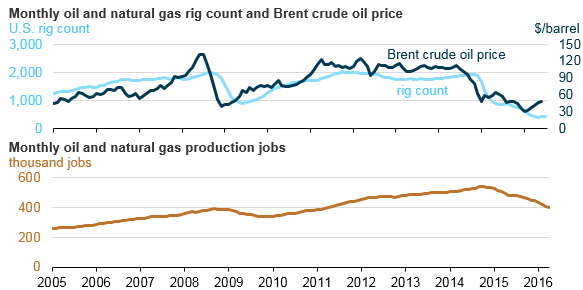
Note: Rig counts are U.S. totals for oil and natural gas, including offshore. Weekly rig count data are converted to monthly data by taking the average weekly readings each month.
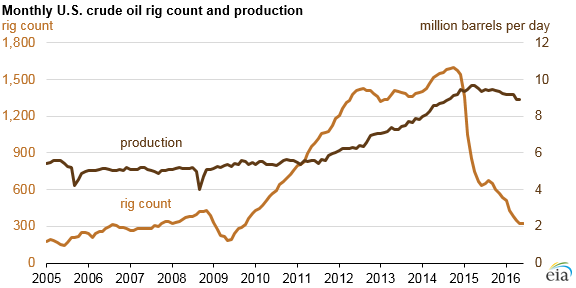
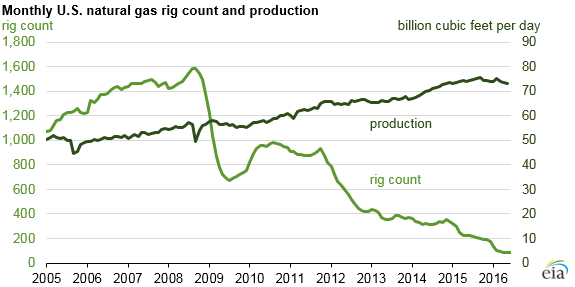
Despite increases in crude oil prices since the start of the year, employment in oil and natural gas extraction and support activities continued declining from levels reached in the fall of 2014, just before the onset of falling oil prices. The total rig count (including both oil-directed and natural gas-directed rigs) has declined even more sharply, from nearly 1,800 rigs in the fall of 2014 to a weekly low of 404 rigs in May 2016. Crude oil production has also declined, but to a much lesser extent than either employment or rig counts, while natural gas production has leveled off.
Employment in oil and natural gas production reached a high of 538,000 jobs in October 2014. Since then, oil and natural gas production employment declined 26%, a loss of more than 142,000 jobs through May 2016, based on the latest jobs data available. The total decrease in production jobs is nearly three times the 51,000 jobs lost over a 13-month period during the 2008–09 recession. Not all production jobs are directly related to drilling—the majority of the jobs are actually for extraction or support activities, which include the operations of drilled wells, exploration, excavation, well surveying, casing work, and well construction. This also includes the maintenance of already producing wells.
The effects of the reduction in drilling and employment in crude oil and natural gas production have been relatively modest, with production levels in May down 6% and 1%, respectively, relative to their level in May 2015. Compared to October 2014, the peak month for employment in the sector, May 2016 crude oil production was 2% lower, while natural gas production was flat.
The divergence between trends in rig counts and employment on the one hand and oil and the trends of natural gas production on the other are attributable to increases in production per new well in key regions, driven in part by advances in siting and drilling technology. For instance, new-well oil production per rig so far in 2016 has been more than twice its 2013 level in areas such as the Bakken, Eagle Ford, and Permian. Growing offshore crude oil production in the Gulf of Mexico has also helped to offset declines in Lower 48 onshore production.
Principal contributor: Robert McManmon