Natural gas storage working capacity grows 2% in 2012
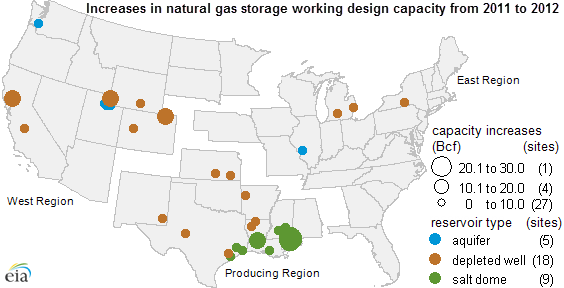
Note: Locations of storage facilities presented on the map are approximate. Some symbols representing storage facilities may overlap.
EIA has two measures of the volume of working natural gas that can be stored in underground facilities for future use—demonstrated maximum and design capacity—and both increased by about 2% from November 2011 to November 2012, according to EIA's latest report. Working natural gas is the volume of gas in a reservoir that is available for withdrawal.
Demonstrated maximum working gas volume represents an operational measure of underground storage capacity, whereas the design capacity reflects an engineering measure of capacity. Demonstrated maximum working gas volume increased 77 billion cubic feet (Bcf) from the 2006-2011 level to the 2007-2012 level. Working gas design capacity increased 91 Bcf, to 4,575 Bcf between 2011 and 2012.
Based on projects already under construction, EIA estimates that another 71 Bcf of planned design storage capacity may be added to the grid in the Lower 48 in 2013. This estimate includes 34 Bcf of salt dome capacity in the Producing region and another 37 Bcf in the West region, with no capacity expected to come on line in the East in 2013. This lack of growth in natural gas storage capacity may be partly explained by readily available volumes of Marcellus Shale gas.
The maximum demonstrated working gas volume is a practical measure of full storage. Filling storage, which requires compressors to inject the gas into the storage facility, becomes more difficult and expensive as storage volume nears its maximum and pressures inside the facility increase. That's why the demonstrated maximum is generally less than the design capacity, averaging 93% over the past two five-year comparison periods (see table below), and why any given week's storage inventory is generally less than the demonstrated maximum. The maximum demonstrated volume provides guidance to operators and market analysts on the economics of filling the system. Last October, for example, when working gas in storage reached a record high of 3,930 Bcf, a simple calculation using the then-current maximum demonstrated volume (4,188 Bcf) showed storage to be 94% full.
Storage capacity rose in most regions between November 2011 and November 2012, reflecting a mix of aquifer, depleted field, and salt dome storage (see map). Four new storage facilities began service in the Lower 48 states during that period.
- East region. Design capacity was virtually unchanged at 2,300 Bcf, but the demonstrated maximum working gas volume for November 2011 fell by about 8 Bcf in the East region because the demonstrated maximum working gas volumes declined for some storage fields since the previous (December 2006-November 2011) comparison period.
- Producing region. Design capacity of facilities in the Producing region accounted for the biggest increase in net capacity of 56 Bcf. Increases took place mostly at existing facilities, with the largest expansions occurring at salt dome facilities in Mississippi and Louisiana. The demonstrated maximum working gas capacity for salt dome and nonsalt dome facilities rose 32 Bcf and 25 Bcf, respectively, in the Producing region.
- West region. Of the four new facilities beginning operations, three came on line in the West.
- Lower 48. Total design capacity and demonstrated maximum working gas capacity in the Lower 48 states rose 91 Bcf and 77 Bcf, respectively.
Demonstrated maximum working gas volume |
Working gas design capacity (Bcf) |
Demonstrated maximum working gas as share of working gas design capacity |
||||||||
|---|---|---|---|---|---|---|---|---|---|---|
| Region | Dec. 2006-Nov. 2011 | Dec. 2007-Nov. 2012 | Nov. 2011 | Nov. 2012 | Nov. 2011 | Nov. 2012 | ||||
| East | 2,210 R | 2,202 | 2,300 | 2,300 | 96% | 96% | ||||
| Producing | 1,391 R | 1,448 | 1,466 | 1,522 | 95% | 95% | ||||
| Salt | 339 R | 371 | 344 | 407 | 98% | 91% | ||||
| Nonsalt | 1,052 | 1,077 | 1,122 | 1,114 | 94% | 97% | ||||
| West | 587 | 616 | 717 | 753 | 82% | 82% | ||||
| Lower 48 | 4,188 | 4,265 | 4,484 | 4,575 | 93% | 93% | ||||
Source: U.S. Energy Information Administration, Peak Underground Working Natural Gas Storage Capacity. | ||||||||||
Tags: capacity, map, natural gas, storage, storage