We no longer publish U.S. Natural Gas Imports & Exports. The data that was published on this page can be found elsewhere on the website, on the Natural Gas data page and in the Natural Gas Monthly.
Summary
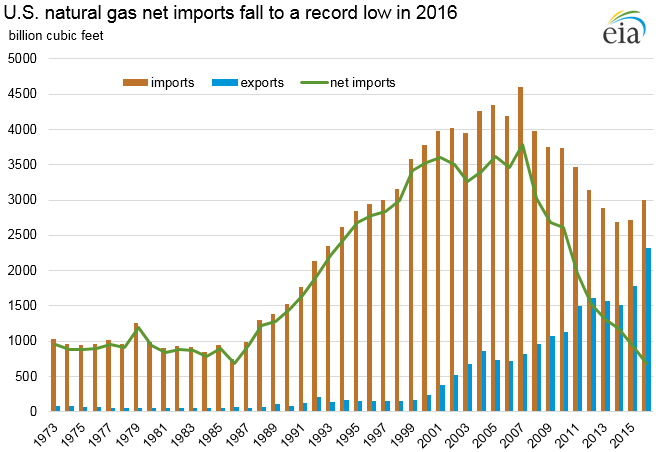
Natural gas net imports (imports minus exports) set a record low of 685 billion cubic feet (Bcf) in 2016, continuing a decline for the 9th consecutive year. In recent years both U.S. natural gas production and consumption have increased, although production has grown slightly faster, reducing the reliance on natural gas imports and lowering domestic prices. Based on preliminary data, 2016 domestic dry natural gas production was 26,459 Bcf, a 2% decrease from the record level of 27,060 Bcf set in 2015, but more than 40% higher than production levels 10 years ago. Preliminary data for 2016 show record total natural gas consumption of 27,495 Bcf, mostly as a result of increases in the electric power sector.
Natural gas exports continued to grow; U.S. exports in 2016 were more than three times larger than the level 10 years ago. Infrastructure improvements, including natural gas pipelines and facilities for liquefying natural gas for export, assisted suppliers in meeting increased demand from foreign markets. The United States is expected to become a net exporter of natural gas on an average annual basis by 2018, according to EIA's Annual Energy Outlook 2017 Reference case.
| five-year (2011-15) average | 2015 | 2016 | 2016 vs. five-year (2011-15) average | 2016 vs. 2015 | |
|---|---|---|---|---|---|
| Imports (Bcf) | |||||
| Pipeline | 2825.0 | 2626.3 | 2912.0 | 3% | 11% |
| LNG | 154.2 | 91.5 | 88.4 | -43% | -3% |
| CNG | 0.3 | 0.3 | 0.3 | 1% | 3% |
| Total | 2980.7 | 2718.1 | 3000.6 | 1% | 10% |
| Exports | |||||
| Pipeline | 1569.6 | 1754.9 | 2128.3 | 36% | 21% |
| LNG | 29.2 | 28.4 | 186.8 | 540% | 558% |
| LNG re-exports | 4.3 | 11.6 | 2.6 | -39% | -78% |
| CNG | 0.1 | 0.2 | 0.2 | 52% | -3% |
| Total | 1598.9 | 1783.5 | 2315.4 | 45% | 30% |
| Net | 1381.7 | 934.6 | 685.3 | -50% | -27% |
Imports
- Natural gas imports increased by 10% to 3,001 Bcf in 2016.
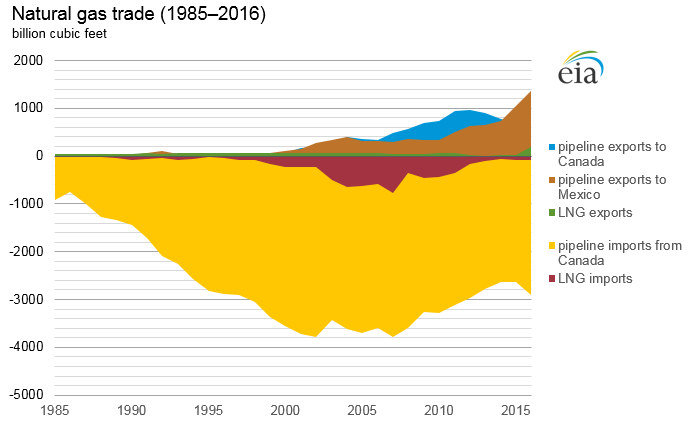
- More than 97% of U.S. natural gas imports come by pipeline from Canada. Canadian imports increased by 11% to 2,912 Bcf in 2016. Pipeline imports from Mexico were less than 1 Bcf in 2016.
- Liquefied natural gas (LNG) imports decreased by 3% to 88 Bcf in 2016, the second-lowest level since 1998. About 95% of the LNG imports are from Trinidad.
- The United States also imported a small amount of compressed natural gas (CNG) from Canada in 2016, about the same level as in 2014 and 2015.
Exports and re-exports
- Natural gas exports increased by 30% to 2,315 Bcf in 2016, a record-high level.
- Pipeline exports account for 92% of U.S. natural gas exports. Pipeline exports to Canada increased by 10% to 771 Bcf. Pipeline exports to Mexico increased by 29% to a record 1,357 Bcf. Pipeline exports to Mexico more than doubled since 2013 and are expected to continue increasing as pipeline projects currently under construction are completed and demand from new natural gas-fueled power plants in Mexico increases.
- In 2016, the Sabine Pass facility in Louisiana became the first operating LNG export facility in the Lower 48 states. Four other LNG export facilities are under construction and are expected to be completed by 2021. These five plants are expected to have a combined operational export capacity of 9.2 Bcf/day.
- The first LNG tanker to transit the expanded Panama Canal departed from Sabine Pass in July 2016. The expansion of the Panama Canal increased export ability by reducing time and transportation costs for LNG vessels transiting from the Atlantic Basin liquefaction terminals to key markets in Asia and the west coast of South America. The expanded canal can accommodate an estimated 90% of the world's LNG tanker fleet.
- LNG exports totaled 187 Bcf in 2016. LNG exports by vessel included shipments to 18 countries, and exports to Chile, Mexico, and China accounted for 40% of the total U.S. LNG exports. Less than 1 Bcf of LNG was exported by truck to Canada and Mexico in 2016.
- LNG re-exports decreased by 78% to less than 3 Bcf in 2016. Re-exports in 2015 were unusually high at more than 11 Bcf.
- The United States also exported a small amount of CNG to Canada, similar to levels over the past three years.
NOTE: Data as of March 2017 from May 2017 Natural Gas Monthly