Analysis of Impacts of a Clean Energy Standard as requested by Chairman Hall
Release date: October 25, 2011
Introduction
This report responds to a request from Chairman Ralph M. Hall for an analysis of the impacts of a Clean Energy Standard (CES). The request, as outlined in the letter included in Appendix A, sets out specific assumptions and scenarios for the study.
Background
A CES is a policy that requires covered electricity retailers to supply a specified share of their electricity sales from qualifying clean energy resources. Under a CES, electric generators would be granted clean energy credits for every megawatt-hour (MWh) of electricity they produce using qualifying clean energy sources. Utilities that serve retail customers would use some combination of credits granted to their own generation or credits acquired from other generators to meet their CES obligations. Generators without retail customers or utilities that generated more clean energy credits than needed to meet their own obligations could sell CES credits to other companies.
The impact of a CES will be sensitive to its design details and to assumptions made regarding the cost of the different fuels and technologies that can be used for electricity generation. Chairman Hall's request asks for an evaluation of a particular CES under a variety of alternative assumptions regarding the costs of generation fuels and technologies.
The CES specified by Chairman Hall, hereinafter referred to as the Hall CES (HCES), has the following characteristics:
- Eligible resources to meet the HCES target include: hydroelectric, wind, solar, geothermal, biomass power, municipal solid waste, landfill gas, nuclear, coal-fired plants with carbon capture and sequestration, and natural gas-fired plants with either carbon capture and sequestration or utilizing combined cycle technology.
- Generators earn 0.5 MWh of compliance credits for every 1 MWh of generation from a combined cycle plant that burns natural gas, and 0.9 MWh of compliance credits for every 1 MWh of generation from coal- or gas-fired generation with carbon capture and sequestration. All other HCES-qualified resources earn one HCES credit for every MWh of generation.
- Generation using qualified resources from either new or existing plants in any economic sector can receive HCES credits.
- The HCES target starts from an initial share of 44.8 percent (qualified generation as a percent of sales) in 2013 and rises linearly to 80 percent in 2035. Beyond 2035, the target remains at 80 percent.
- The HCES will apply to utilities in the aggregate; utilities may trade compliance credits with other utilities.
- There is no option to purchase compliance credits from the government. All credits are backed by physical generation.
- All electricity retailers are covered by the requirement, regardless of ownership type or size.
- HCES credits earned in one year cannot be "banked" for use in a subsequent year. All credits must be used for compliance in the year that the underlying generation was produced.
- HCES obligations are based on total electricity sales, regardless of source. There is no provision for excluding any electricity sales from a seller'ss baseline based on resources used to produce the electricity or type of customer purchasing the electricity.
- The HCES operates independent of any State-level policies. The same underlying generation can be used to simultaneously comply with the HCES and any State generation requirements, if otherwise allowed for by both Federal and State law.
Analysis Cases
Like other EIA analyses of energy and environmental policy proposals, this report focuses on the impacts of those proposals on energy choices in all sectors and the implications of those decisions for emissions and the economy. This focus is consistent with EIA's statutory mission and expertise. The study does not account for any possible health or environmental benefits that might be associated with the HCES policy.
The analysis presented in this report starts from the Annual Energy Outlook 2011 (AEO2011) Reference case1 (REF), which is compared to a case that reflects the HCES requirements outlined in the previous section. The same comparison is repeated under a series of alternative assumptions regarding the costs of generation fuels and technologies. The assumptions used in the eight alternative cases, each of which is run with and without the HCES policy, are briefly summarized below and are more fully explained in Appendix E of the AEO2011.
Nuclear Low Cost (LC-Nuc): Capital and operating costs for new nuclear capacity start 20 percent lower than in the Reference case and fall to 40 percent lower in 2035.
Nuclear High Cost (HC-Nuc): Costs for new nuclear technology do not improve from 2011 levels in the Reference case through 2035.
Renewable Low Cost (LC-Ren): Costs of non-hydropower renewable generating technologies start 20 percent lower in 2011 and decline to 40 percent lower than Reference case levels in 2035. Capital costs of renewable liquid fuel technologies start 20 percent lower in 2011 and decline to approximately 40 percent lower than Reference case levels in 2035.
Renewable High Cost (HC-Ren): Costs of non-hydropower renewable generating technologies remain constant at 2011 levels through 2035. Costs are still tied to key commodity price indexes, but no cost improvement from "learning-by-doing" effects is assumed.
Natural Gas Low Cost (LC-Gas) (corresponds with High Shale Recovery case in the AEO2011): The estimated undeveloped technically recoverable shale gas resource base is 50 percent higher than in the Reference case with the per well recovery rate unchanged from the Reference case, resulting in more wells needed to fully recover the resource.
Natural Gas High Cost (HC-Gas) (corresponds with Low Shale Recovery case in the AEO2011): The estimated undeveloped technically recoverable shale gas resource base is 50 percent lower than in the Reference case with the per well recovery rate unchanged from the Reference case, resulting in fewer wells needed to fully recover the resource.
Coal Low Cost (LC-Coal): Regional productivity growth rates for coal mining are approximately 2.7 percent per year higher than in the Reference case, and coal mining wages, mine equipment costs, and coal transportation rates are between 22 and 25 percent lower by 2035 than in the Reference case.
Coal High Cost (HC-Coal): Regional productivity growth rates for coal mining are approximately 2.7 percent per year lower than in the Reference case, and coal mining wages, mine equipment costs, and coal transportation rates are between 25 and 28 percent higher by 2035 than in the Reference case.
Results
HCES Impacts under AEO2011 Reference case
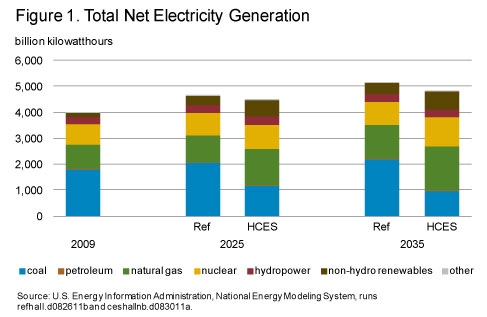
The HCES results in a large shift in the generation mix (Figure 1 and Table B1). Coal-fired generation, which grows by nearly 23 percent between 2009 and 2035 in the Reference case, decreases by 46 percent between 2009 and 2035 in the HCES case. Coal is primarily displaced by increased natural gas generation, which in the HCES case is 38 percent greater than the Reference case level in 2025 and 30 percent greater in 2035. Nuclear and renewable generation also exceed the Reference case projection in the HCES case, though the HCES effect on nuclear generation occurs primarily after 2025.
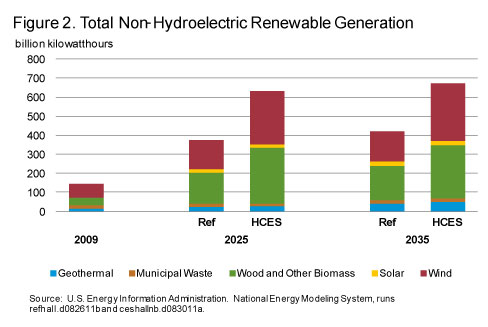
Among renewable sources, wind and biomass have the largest generation increases under the HCES (Figure 2 and Table B1). By 2035, there is nearly twice as much wind generation than without the HCES policy. Additional biomass generation is met primarily through increased co-firing of biomass in existing coal plants, which decreases in the latter part of the projection as new nuclear generation capacity comes online and existing coal capacity is retired.
HCES compliance strategies vary over time. Compliance through 2020 is attained primarily from existing nuclear and renewable capacity, renewable capacity projected to be built with or without the HCES policy, increasing dispatch of existing qualified natural gas plants, and increasing co-firing of biomass. After 2020, an increasing amount of incremental credits are achieved by generation from wind and nuclear capacity additions in excess of the Reference case, as well as coal-firedgeneration from existing plants retrofitted with sequestration technology.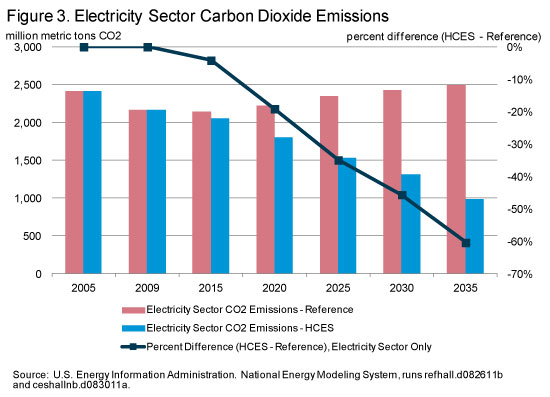
Annual electricity sector carbon dioxide emissions decrease by more than 50 percent between 2009 and 2035 under the HCES (Figure 3 and Table B1). In the Reference case scenario, however, electricity-sector carbon dioxide emissions increase over the forecast period to reach 2,500 million metric tons of carbon dioxide (MMTCO2) by 2035. In 2025, the electric power sector accounts for 1,525 MMTCO2 under the HCES, which is 35 percent less than in the Reference case. By 2035, HCES electric power sector emissions are 60 percent below the Reference case.
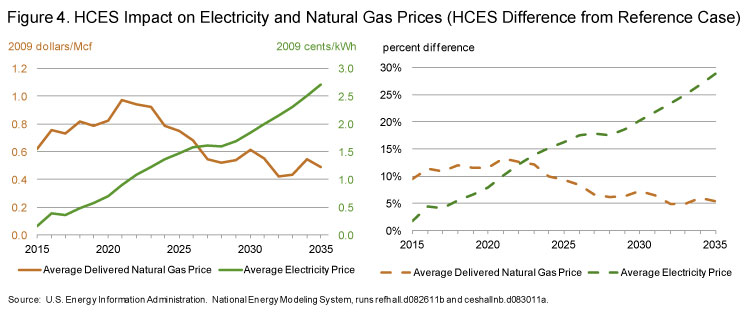
The HCES has an increasing impact on average electricity prices from 2015 through 2035 (Figure 4 and Table B1). The impacts on electricity prices prior to 2015 are negligible, because the Reference case projects sufficient eligible generation to nearly meet the HCES requirement. Beyond 2015, electricity prices under the HCES rise above the Reference case level, and the difference grows steadily through 2035. In 2025, the average HCES electricity price is 10.5 cents/kWh – or about 1.5 cents (16 percent) greater than without the policy. In 2035, the average electricity price under the HCES exceeds the Reference case average price by 2.7 cents/kWh (29 percent).
The HCES impact on electricity prices varies significantly across regions (Table 1). In 2035, the HCES impact on average electricity prices ranges between negative 1.6 cents/kWh (indicating that the average electricity price is actually lower under the HCES than the reference case) and positive 8.4 cents/kWh. Regions that are more dependent on generation fuels that are not HCES-eligible, primarily coal, in general experience a stronger price impact.
| Region | 2009 | 2025 | 2035 | |||
|---|---|---|---|---|---|---|
| Reference | HCES | Reference | HCES | |||
| 1 | ERCT - ERCOT All | 10.4 | 9.2 | 11.8 | 10.0 | 14.2 |
| 2 | FRCC - FRCC All | 11.6 | 10.9 | 13.4 | 11.2 | 15.0 |
| 3 | MROE - MRO East | 9.3 | 7.5 | 8.2 | 7.3 | 5.6 |
| 4 | MROW - MRO West | 7.6 | 6.8 | 8.3 | 6.9 | 9.0 |
| 5 | NEWE - NPCC New England | 15.7 | 13.6 | 15.0 | 13.1 | 16.8 |
| 6 | NYCW - NPCC NYC/Westchester | 19.9 | 16.8 | 19.1 | 16.9 | 22.3 |
| 7 | NYLI - NPCC Long Island | 18.1 | 16.7 | 21.2 | 16.6 | 25.1 |
| 8 | NYUP - NPCC Upstate NY | 11.6 | 11.9 | 14.1 | 12.6 | 17.1 |
| 9 | RFCE - RFC East | 12.2 | 10.7 | 13.3 | 10.9 | 16.4 |
| 10 | RFCM - RFC Michigan | 9.6 | 8.7 | 10.3 | 9.0 | 12.2 |
| 11 | RFCW - RFC West | 8.6 | 8.5 | 10.9 | 9.9 | 12.9 |
| 12 | SRDA - SERC Delta | 7.5 | 7.3 | 6.9 | 7.5 | 7.3 |
| 13 | SRGW - SERC Gateway | 7.8 | 6.5 | 8.5 | 7.0 | 11.3 |
| 14 | SRSE - SERC Southeastern | 9.1 | 8.7 | 9.2 | 8.5 | 9.9 |
| 15 | SRCE - SERC Central | 7.8 | 6.0 | 7.0 | 6.0 | 8.8 |
| 16 | SRVC - SERC VACAR | 8.6 | 8.1 | 8.7 | 8.3 | 9.8 |
| 17 | SPNO - SPP North | 7.9 | 7.6 | 9.5 | 7.5 | 10.2 |
| 18 | SPSO - SPP South | 6.9 | 7.8 | 10.2 | 8.5 | 12.4 |
| 19 | AZNM - WECC Southwest | 9.8 | 9.5 | 10.6 | 10.4 | 11.9 |
| 20 | CAMX - WECC California | 13.3 | 14.6 | 13.6 | 13.2 | 13.8 |
| 21 | NWPP - WECC Northwest | 7.0 | 4.6 | 4.6 | 5.2 | 5.6 |
| 22 | RMPA - WECC Rockies | 8.2 | 9.0 | 12.4 | 9.4 | 13.9 |
| U.S. Average | 9.8 | 9.0 | 10.5 | 9.4 | 12.1 | |
| HCES electricity price is 10-25 percent greater than the Reference case electricity price | ||||||
| HCES electricity price is 25 percent or more greater than the Reference case electricity price | ||||||
| Source: U.S. Energy Information Administration. National Energy Modeling system, runs refhall.d082611 and ceshallnb.d083011a. Note: See Appendix C for a map of the NEMS electricity market module regions. |
||||||
Natural gas prices increase under the HCES, particularly in the earlier part of the projection. Average delivered natural gas prices exceed Reference case average delivered prices by $0.75/Mcf (9.3 percent) in 2025, but only $0.49/Mcf (5.4 percent) in 2035. Unlike in the case of electricity, the HCES impact on natural gas prices does not increase throughout the entire projection. In earlier years of the legislation, natural gas accounts for much of the incremental HCES compliance, which results in a surge in natural gas prices. As other compliance options are built, however, the differential between natural gas prices with and without the HCES remains between about 5 percent and 10 percent from 2025 to 2035.
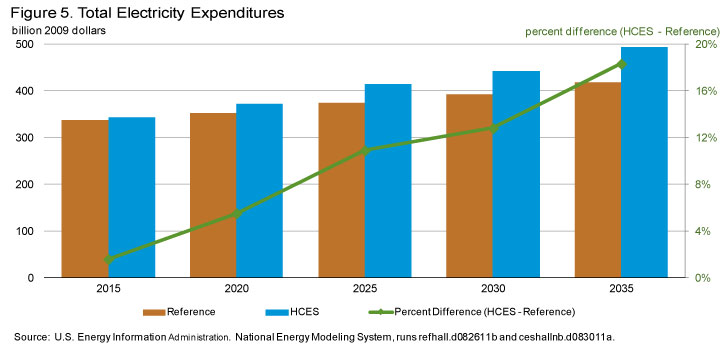
Electricity expenditures increase under the HCES as a result of higher electricity prices (Figure 5 and Table B1). However, because electricity sales decrease slightly, the impact is smaller than the impact on electricity prices. In 2035, total electricity expenditures under the HCES policy are 18 percent above the projected Reference case level. In 2025, the average household spends $1,277 per year on electricity – $115 above the Reference case –and by 2035, expenditures rise to $1,407 per year – $211 above the Reference case.
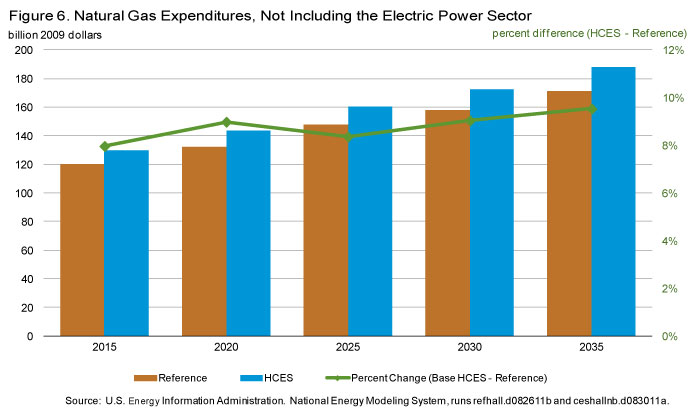
Higher natural gas prices lead to increased natural gas expenditures outside the electricity sector under the HCES (Figure 6 and Table B1). In 2025, non-electric natural gas expenditures under the HCES exceed Reference case expenditures by 8 percent. This differential increases to 10 percent by 2035. In comparison to non-electric natural gas expenditures, natural gas expenditures in the electric power sector experience a dual upward pressure, from both higher prices and higher consumption. Particularly in early years, when increasing natural gas use at existing plants accounts for the greatest share of HCES compliance, the expenditure effect is quite large.
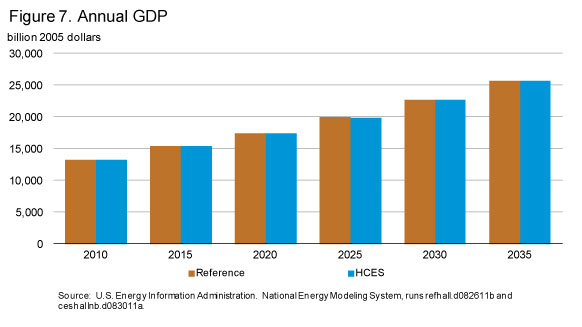 The HCES reduces real GDP relative to the Reference case, though this effect moderates toward the end of the projection period (Figures 7 and 8 and Table B1). The peak negative impact is less than eight-tenths of one percent, realized in 2024. In the latter part of the projection, however, GDP under the HCES converges back toward the Reference case. GDP grows at an average annual rate of 2.68 percent between 2009 and 2035 under the HCES, just slightly below the Reference case growth rate of 2.69 percent. Real GDP per capita2 in 2035 is $65,658 under the HCES, versus $65,848 in the Reference case – a reduction of about 0.3 percent.
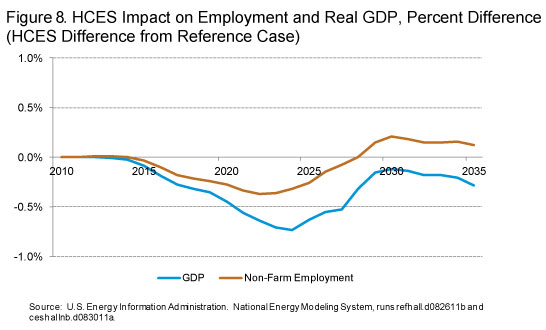 The HCES negatively affects non-farm employment from 2015 through the mid-2020's, but employment recovers toward the end of the projection period, following the trend of GDP. The change in overall energy prices peaks in 2025 and then begins to return to Reference case levels. In addition, the amount of diverted energy investment peaks in the mid-2020's, resulting in fewer diverted resources and productivity impacts later in the projection period. Service-sector employment leads the employment recovery, as services use relatively less energy than the manufacturing sector.
Sensitivity Analysis
The HCES could have a different effect when resource or technology costs diverge from the assumptions used in the Reference case. The following section considers the effect of the HCES when applied to different baseline scenarios. Per the request from Chairman Hall, EIA models the effect of the HCES given nine sensitivity scenarios, each of which are described in the introduction to this report.3 Therefore, this section considers eighteen individual model scenarios – nine baseline sensitivity scenarios, and then the HCES under each of those scenarios. For the purpose of presenting the material in a digestible format, most of the discussion and Figures 10, 11, 12, and 14 below focus on the impact of the HCES, which is always described in reference to a specific corresponding baseline scenario. For example, the impact of the HCES on electricity prices in the low-cost nuclear case compares electricity prices under the HCES in the low-cost nuclear scenario to electricity prices in the low-cost nuclear case without the HCES. This approach isolates the effect of the policy from the underlying scenario assumptions. For this reason, the HCES cases with the highest or lowest impact on a given indicator do not necessarily reflect the cases that yield the highest or lowest level of that indicator. Tables B2 through B5 provide results for levels in all of the sensitivity cases.
The HCES causes coal-based generation to decline significantly in all sensitivity cases (Figure 9). In 2009, coal plants provided 45 percent of total power generation. However, by 2025 the share of generation from coal ranges from 22 percent to 27 percent in the HCES sensitivity cases, versus 41 percent to 46 percent in the base cases. The fall continues after 2025, when the share ranges from 10 percent to 20 percent in 2035 in the HCES sensitivity cases, versus 37 percent to 44 percent in the base cases. Of the HCES sensitivity cases, the highest share for coal occurs in the high-cost natural gas HCES case, while the lowest occurs in the high-cost coal HCES case. The HCES has the greatest impact – or causes the greatest reduction in coal-fired generation – in the low-cost renewable sensitivity case.
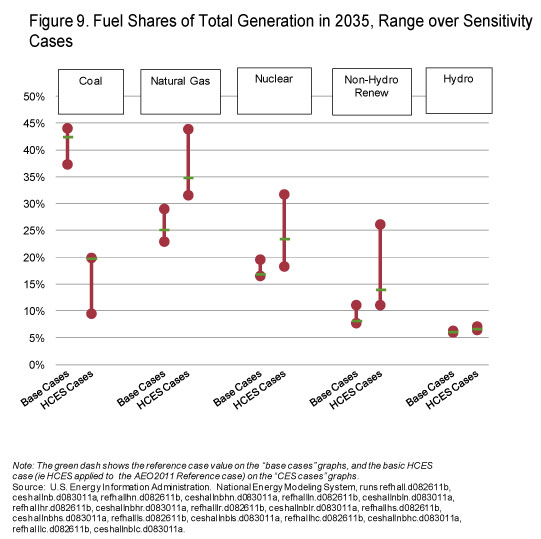
In contrast to the situation for coal, natural gas generation and non-hydroelectric renewable generation each increase significantly in the HCES sensitivity cases. However, there is significant variation in their share of total generation, depending on the underlying assumptions about their costs and the costs of other technologies. The share of generation coming from natural gas in the HCES sensitivity cases in 2035 varies from 32 percent to 44 percent, compared to 23 percent to 29 percent in the base cases. Among the HCES sensitivity cases, the highest share for natural gas occurs in the high-cost coal HCES case, while the lowest share occurs in the low-cost nuclear HCES case. Natural gas generation is most significantly impacted by the HCES in the high-cost nuclear case, where natural gas generation under the HCES exceeds the base case by 51 percent. The share of generation coming from non-hydroelectric renewables in the HCES sensitivity cases in 2035 varies from 11 percent to 26 percent – again, well above the 8 percent to 11 percent range of the base cases. The highest share occurs in the low-cost renewable HCES case and the lowest shares occur in the high-cost renewables and low-cost nuclear HCES cases. However, the impact of the HCES on the non-hydroelectric renewable generation is greatest in the low-cost renewable sensitivity case, in which non-hydroelectric renewable generation under the HCES exceeds the base case level by 118 percent.
Nuclear generation also increases under the HCES relative to baseline scenarios. However, the magnitude of the effect is extremely sensitive to the underlying baseline scenario. In the high-cost nuclear scenario, nuclear generation under the HCES is only 0.8 percent greater in 2035 than the associated low-cost nuclear baseline. In contrast, nuclear generation under low-cost nuclear assumptions with the HCES exceeds the low-cost nuclear baseline by 54.6 percent. Significant effects on nuclear generation are primarily concentrated in the latter part of the projection period (2025 and after).
Natural gas is the leading source of generation by 2035 under the HCES in most of the HCES sensitivity cases. The notable exception to this trend is in the low-cost nuclear scenario, where relatively affordable nuclear capacity displaces natural gas as HCES-qualified baseload generation.
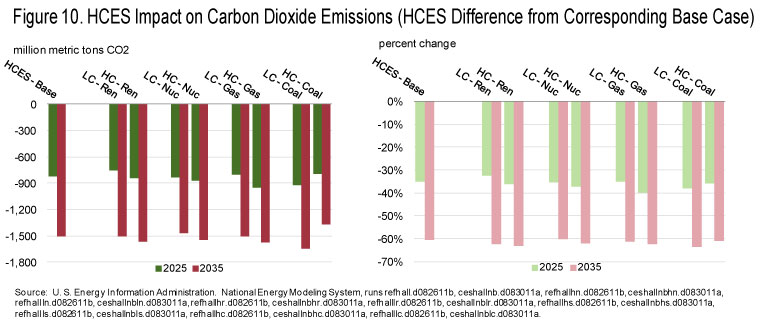 Carbon dioxide emissions in the electric power sector fall significantly as a result of the HCES in all sensitivity cases (Figure 10). In each sensitivity case, the HCES results in emissions that are 33 percent to 40 percent lower than the associated base case levels in 2025, and 60 percent to 64 percent lower than the associated base case levels in 2035. Reductions are most significant in the low-cost coal scenario. Conversely, reductions in the high-cost coal scenario appear to be relatively modest – however, this is somewhat misleading, because the absolute level of emissions is actually lowest in the high-cost coal sensitivity case. The high cost of coal drives a reduction in coal-fired generation regardless of the HCES policy, and, therefore, the HCES policy has a lesser impact.
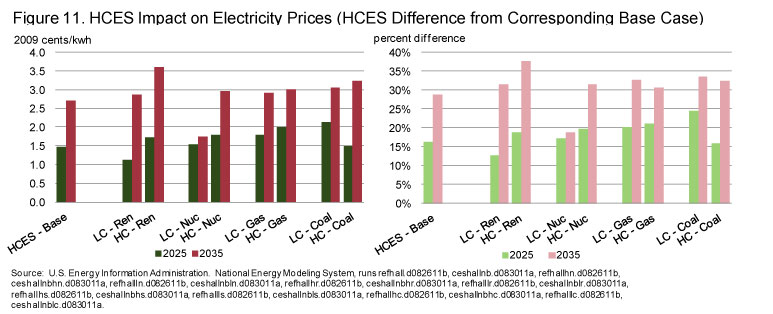
Electricity prices under the high-cost renewables scenario exhibit greater sensitivity to the HCES than in the other cases. Conversely, the price impact of the HCES is lowest in the low-cost nuclear scenario. In the high-cost renewables scenario, utilities still install significantly more non-hydroelectric renewable electricity than in the baseline high-cost renewable scenario. Because this technology is relatively more expensive to build, this additional cost translates into higher HCES credit prices (that is, compliance costs), which, in turn, increases electricity prices. In the low-cost nuclear scenario, the HCES has a relatively minimal impact over time, because a larger portion of overall HCES compliance can be met through generation from new nuclear capacity, the cost of which this scenario sets to be 40 percent less than the Reference case in 2035.
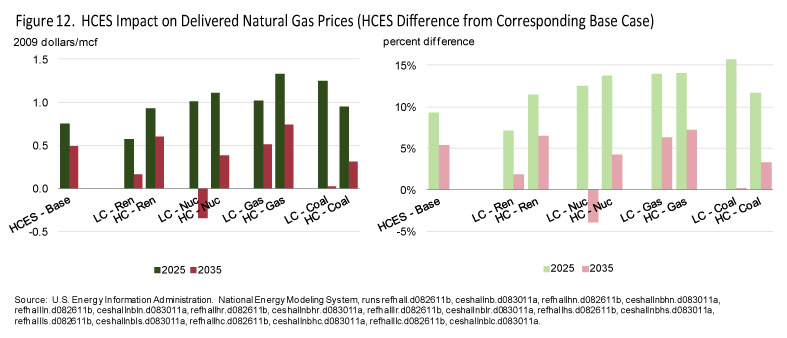 Natural gas prices generally increase under the HCES; however, the magnitude of this impact decreases toward the end of the projection horizon as other compliance options are increasingly available and attractive (Figure 12). This temporal pattern is generally consistent when the HCES is applied to alternative baseline scenarios. Interestingly, in the low-cost nuclear scenario, natural gas prices under the HCES in 2035 are actually lower than without the HCES policy, due to the much greater amount of nuclear generation capacity that is built in the latter part of this scenario. The HCES has the greatest price impact on natural gas in the high-cost natural gas case.
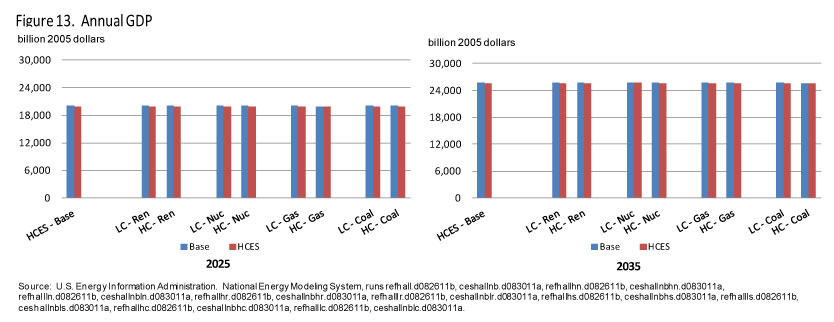 The finding that the HCES results in lower GDP is also robust across scenarios. However, consistent with the main case results, the impact on the growth rate of GDP is small. The average annual GDP growth rate over the 2009 to 2035 period ranges from 2.66 percent to 2.69 percent across the range of HCES sensitivity cases, compared to 2.68 percent to 2.69 percent in the corresponding base cases. In 2035, annual GDP ranges from $25,623 billion to $25,710 billion in the base case scenarios, versus a range of $25,514 billion to $25,705 billion under the HCES legislation (Figure 13). On a per capita basis, this translates to base case ranges between $65,686 per person and $65,909 per person, compared to a range of $65,406 per person to $65,897 per person under the HCES.
 The negative effect on cumulative discounted GDP between 2009 and 2035 is less than 0.3 percent in all scenarios (Figure 14). In most sensitivity cases, annual GDP exhibits a recovery relative to the corresponding base case in the latter part of the projection (recall Figure 8). The nearer-term (2025) impact is strongest in the low-cost gas, high-cost nuclear, and low-cost coal scenarios. In the latter case, the differential is large because utilities cannot fully take advantage of the low-cost coal while still complying with the HCES. This forces retirement of plants that would be able to produce electricity relatively cheaply, and diverts investment from lower cost alternatives.
Footnotes
1The Reference Case in this report includes some revisions to the AEO2011 Reference Case. The primary changes include an improved representation of interregional capacity transfers for reliability pricing and reserve margins. Also, capacity expansion decisions incorporate better foresight of future capital cost trends by including expectations of the commodity price index.
2Real GDP and real GDP per capita are reported in 2005 dollars.
3The baseline scenarios are: the Reference case, high-cost nuclear, low-cost nuclear, high-cost renewables, low-cost renewables, high-cost gas, low-cost gas, high-cost coal and low-cost coal.