Nu clear Power Outlook
Release Date: 5/7/18
In EIA’s Annual Energy Outlook 2018 (AEO2018) Reference case, U.S. nuclear power generating capacity is projected to decline from 99.3 gigawatts (GW) to 79.1 GW over the projection period of 2017–50. To address some of the uncertainty surrounding this projection, this article presents sensitivity cases under different assumptions for oil and natural gas availability, nuclear power unit costs, and carbon policies.
The sensitivity cases results presented here illustrate three different types of uncertainty (Table 1):
- The uncertainty related to higher or lower levels of natural gas availability as addressed in the High Oil and Natural Gas Resource and Technology case and the Low Oil and Natural Gas Resource and Technology case.
- The uncertainty of lower or higher operating and capital costs for both new and existing nuclear units.
- The uncertainty of alternative levels of carbon emissions regulation, as represented by different fees on the emissions of carbon dioxide (CO2).
| Sensitivity Cases | Description |
|---|---|
| Reference | Assumes trend improvement in known technologies along with expectations of the continuation of current economic and demographic trends |
| High Oil and Natural Gas Resource and Technology (HRT) | Applies lower extraction costs and higher resource availability than in the Reference case, which allows for higher levels of oil and natural gas production at lower delivered prices |
| Low Oil and Natural Gas Resource and Technology (LRT) | Applies higher extraction costs and lower resource availability than in the Reference case, which results in lower levels of oil and natural gas production at higher delivered prices |
| Reference, HRT, and LRT +/- 20% nuclear power unit cost (6 cases) | Increases and decreases the operating and capital costs for both new and existing nuclear units by 20% under the Reference case and in the HRT and LRT cases |
| Carbon Fee with $15 and $25 per ton CO2 (2 cases) | Modifies the Reference case by including a cost for CO2 emissions from utility-scale electricity generation at either $15 or $25 per ton CO2 ($2017) starting in 2020 and escalating at 5% per year in real dollar terms |
When natural gas prices rise faster and higher, as projected in the LRT case, nuclear capacity retirements decline by 3.9 GW though 2050 to 22.3 GW, compared with approximately 26.2 GW of nuclear retirements in the Reference case. In contrast, in the High Oil and Natural Gas Resource and Technology (HRT) case, where natural gas prices are estimated to remain near 2017 levels, nuclear power plant retirements increase by 23.8 GW through 2050 to 50.0 GW.
When nuclear unit operating costs increase or decrease by 20%, retirements increase or decrease across all of the sensitivity cases, accordingly. With 20% higher costs, retirements by 2050 increase by slightly more than 4.2 GW in the LRT case; however, they increase by 13.1 GW and 37.2 GW in the Reference case and in the HRT case, respectively, under 20% higher cost conditions. In contrast, decreasing nuclear power plant costs by 20% results in 2.6 GW less retirements in the LRT case, 4.7 GW less retirements in the Reference case, and 23.6 GW less retirements in the HRT case.
Under the carbon fee scenarios, nuclear power plant retirements decline and new nuclear power capacity is added after 2037, with total fleet capacity ranging between 27.3 GW and 65.7 GW higher through 2050, depending on the magnitude of the carbon fee.
These sensitivity analyses do not address all of the future market developments that may affect nuclear power. Other uncertainties include new state policy assumptions on renewable portfolio standards, clean energy strategies, price support for financially at-risk nuclear power plants, investments to address grid congestion, and other energy-related federal policies. In addition, nuclear waste management is not modelled in EIA’s National Energy Modeling System (NEMS) because it is funded through the nuclear waste fund and has no effect on plant-level economics. Further, the issue of social license where public opinion, at both the local and state levels, can influence state policy and legal actions is not directly modelled in NEMS. However, social licensing can be seen as a contributing factor to the recent announced plant closings and project decisions that are represented in NEMS as well as the New York and Illinois zero-emission credit (ZEC) legislations.
Discussion
The structure of the electricity markets, recent developments in the domestic nuclear power industry, and the diversity of plants in the nuclear fleet all need to be examined when considering projections of nuclear capacity, generation, and retirements.
Market structure
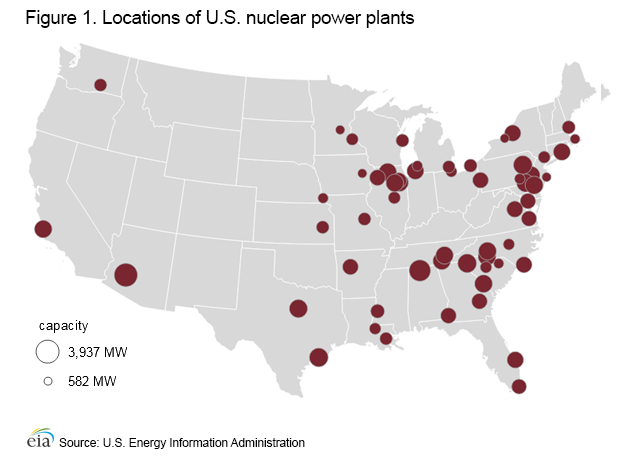
Of the 60 nuclear plants operating in the United States (Figure 1), 31 generate and sell electricity into deregulated (i.e., merchant) wholesale electricity markets, where they compete with other generating capacity resources at the sub-regional level.[1] In merchant markets, wholesale electricity prices are determined using locational marginal pricing, which accounts for the effects of load and generation patterns, transmission constraints, and the generation mix at specific nodes on the system. As a result, each nuclear plant will experience its own pricing environment. Combined with their own unique operating costs, merchant nuclear power plants experience a range of financial conditions, as reflected by the diverse set of recent and announced early retirements of nuclear power plants.[2]
Recent developments
Natural gas used for electricity generation has increased and replaced a large portion of coal-fired generation, resulting in the retirement of some coal plants.[3] The continued growth in the production of low-cost natural gas from shale and other tight source rock, particularly in the Marcellus and Utica formations in West Virginia, Pennsylvania, and Ohio, is providing electricity generators a lower-cost alternative that has resulted in lower wholesale electricity prices. Some electricity markets experienced a 40% drop in wholesale electricity prices from 2007 to 2016.[4] In addition, the growth in the use of renewables, namely wind and solar, and relatively flat growth in electricity demand has created increased competition and lower electricity prices in wholesale power markets.
Nuclear power plants operating in merchant markets are experiencing lower electricity prices, which can, if low enough, result in unprofitable conditions. Since 2013, five nuclear plants have closed.[5] In 2017, four plants reversed their closing decisions after receiving state price supports in the form of zero-emission credits.[6] Six nuclear plants are scheduled to permanently shut down by 2025 for economic reasons, some in conjunction with necessary, major capital improvements required by federal or state regulators. Five additional nuclear plants have also requested state-level price support.[7]
Before 2013, the last nuclear power reactor to close was the 660-MW Millstone Unit 1 reactor in 1998. According to reported statements by the owner, the decision to permanently close the reactor was based on a risk-adjusted net present-value assessment of the reactor operating in a newly-created, deregulated market where the estimated annual revenue would be less than 1% of the anticipated cost of restoring the unit to commercial operations.[8]
In addition to low wholesale electricity prices, other economic conditions are contributing to the financial uncertainties facing some nuclear power plants. For example, large capital investments to build closed-cycle water cooling towers would be required for the Indian Point plant (New York) and the Diablo Canyon plant (California) to continue to operate. New York and California cited environmental restrictions that will preclude continued use of river and ocean water for cooling.[9 ]
The Indian Point nuclear plant in New York is scheduled to retire in 2021 due to environmental and safety concerns.[10] Indian Point is a two-unit plant supplying approximately 12% of the state’s electricity demand. In January 2018, the California Public Utilities Commission voted to approve a plan to close the Diablo Canyon Nuclear Power Plant in 2025.[11] Based on several news reports, the commission concluded that the plant would soon become uneconomical to operate due to changes in the power grid – growth in renewables, increases in energy efficiencies, cost-prohibitive capital investments to develop an alternative cooling system, and the development and increased use of local electricity suppliers. For example, in October 2015, Governor Edmund Gerald Brown Jr. signed into legislation Senate Bill 350, which requires retail sellers and publicly-owned utilities to procure 50% of their electricity from eligible renewable energy resources by 2030.[12]
New York and Illinois passed legislation in 2016 and 2017, respectively, that provides ZECs for nuclear power plants experiencing unprofitable market conditions. The ZEC values are calculated based on plant financial shortfalls, are capped, and expire in 12 years in New York and 10 years in Illinois.[13,14] As a result of these laws, the announced closing decisions for R. E. Ginna, Nine Mile Point, and Fitzpatrick nuclear power plants in New York and for Clinton and Quad Cities nuclear power plants in Illinois were reversed.[15,16] Connecticut, New Jersey, Pennsylvania, and Ohio are considering similar types of measures to support nuclear reactors in their states.
The most recent addition to the nuclear fleet was the Watts Bar Unit 2 reactor in eastern Tennessee in 2016. The next-youngest operating reactor is Watts Bar Unit 1, which entered service in 1996. The construction project of two nuclear power reactors (Westinghouse AP-1000 design) at the Vogtle nuclear plant in Georgia has incurred significant project cost escalations and schedule delays. Following a project review in 2017, Georgia Power and its public-power partners opted to continue construction of the Vogtle plant and recently received approval to do so from the Georgia Public Service Commission. Conversely, the owners of the South Carolina V. C. Summer plant decided to terminate the construction of two AP-1000 design reactors that were also experiencing similar cost escalations and schedule delays. Both the Georgia and South Carolina projects had the same reactor design, contractor, and construction strategy.
As of September 13, 2017, seven Nuclear Regulatory Commission licensees had combined (build and operate) licenses for new reactors, including the Vogtle and V. C. Summer projects. Other combined licenses issued include the following
- DTE Electric Company for the Enrico Fermi Nuclear Plant Unit 3
- South Texas Project Nuclear Operating Company for South Texas Project Units 3 and 4
- Duke Energy Florida, LLC for Levy Nuclear Plant Units 1 and 2
- Duke Energy Carolinas, LLC for William States Lee III Nuclear Station Units 1 and 2
- Virginia Electric and Power Company for the North Anna Unit 3
These licensees have not submitted plans to proceed further.[17]
According to the Nuclear Energy Institute, the nuclear power industry has implemented a coordinated strategy “to transform the industry and ensure its viability for consumers as well as its essential role in protecting the environment.” [18]That strategy includes identifying areas to reduce costs with a target of reducing overall nuclear plant operating costs by as much as 30%.[19]
The announced retirements, new builds, project cancellations, reversal of closure decisions, and ZECs are all included in the AEO2018 Reference case.
Nuclear plant sizes
U.S. nuclear power plants range in size from the 582 MW R. E. Ginna plant in upstate New York to the 3,937 MW Palo Verde plant west of Phoenix, Arizona. The average plant size of the U.S. nuclear fleet is 1,656 MW. The profitable operation of smaller, single-unit plants in merchant electricity markets are more sensitive to lower wholesale electricity prices than larger plants in regulated markets. Smaller single-unit plants have higher unit costs because their fixed overhead costs are spread over less generation than larger plants, and they cannot take advantage of the same economy-of-scale when negotiating service and fuel contracts as owners of multi-unit plants and fleets. Most of the merchant plants that are smaller than average have either announced plans to close, requested state price support, or reversed earlier closing decisions following the passage of state-level price support (Table 2). The two plants (Duane Arnold and Palisades) operating under existing, long-term power purchase agreements at prices set to ensure their general viability are not currently experiencing the wholesale pricing effects of low-priced natural gas generation. However, the expiration of the existing agreements will expose them to wholesale electricity market conditions if new power purchase agreements are not established beforehand.[20,21,22]
| Plant | 2016 Summer Capacity (MW) |
Current Status | Location |
|---|---|---|---|
| R. E. Ginna | 582 | Reversed closing decision following enactment of zero-emission credit legislation within New York’s Clean Energy Standard | Ontario, NY |
| Duane Arnold | 601 | Operating under a purchase agreement that is scheduled to terminate in 2025 | Palo, IA |
| Oyster Creek | 608 | Announced decision to close in 2018 | Forked River, NJ |
| Pilgrim | 682 | Announced decision to close in 2019 | Plymouth, MA |
| Palisades | 784 | Announced decision to close following expiration of existing purchase agreement in 2022[23] | Covert, MI |
| Three Mile Island | 803 | Announced decision to close in 2019[24] | Middletown, PA |
| James A. FitzPatrick | 837 | Reversed decision to close following enactment of zero-emission credit legislation within New York’s Clean Energy Standard[25] | Scriba, NY |
| Davis-Besse | 894 | Owner announced that plant is unprofitable[26] | Oak Harbor, OH |
| Clinton Power Station | 1,065 | Reversed decision to close following enactment of Illinois zero-emission credit legislation (Future Energy Jobs Act) [27] | Clinton, IL |
| Fermi | 1,124 | No announcement | Newport, MI |
| PSEG Hope Creek | 1,172 | Requested state price support within two years[28] | Hancocks Bridge, NJ |
| Point Beach | 1,196 | No announcement | Two Rivers, WI |
| Perry | 1,240 | Owner announced that plant is unprofitable[29] | Perry, OH |
| Seabrook | 1,248 | No announcement | Seabrook, NH |
| Source: U.S. Energy Information Administration, Nuclear Reactor, State, and Net Capacity and nuclear power plant owner public announcements | |||
Results
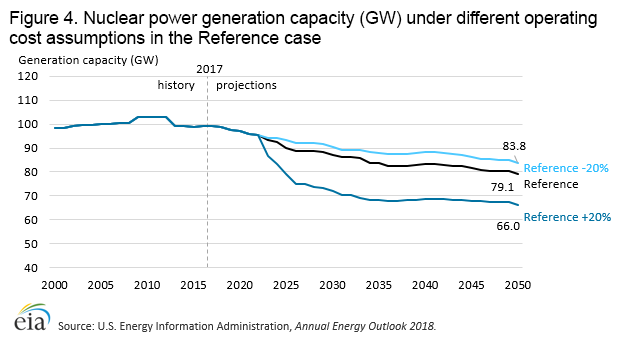
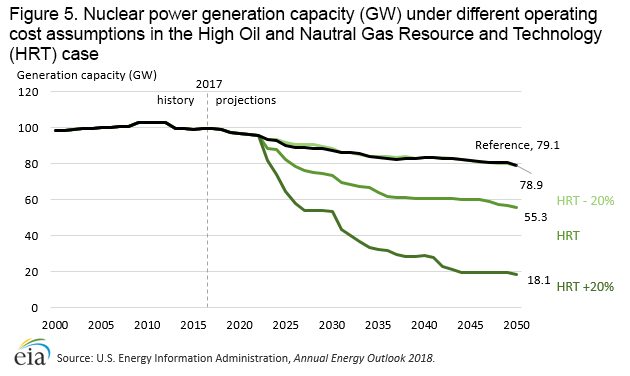
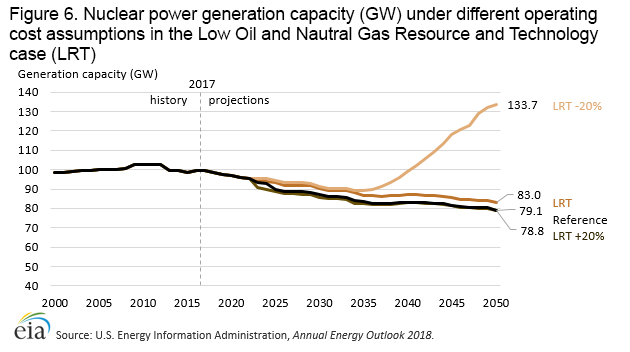
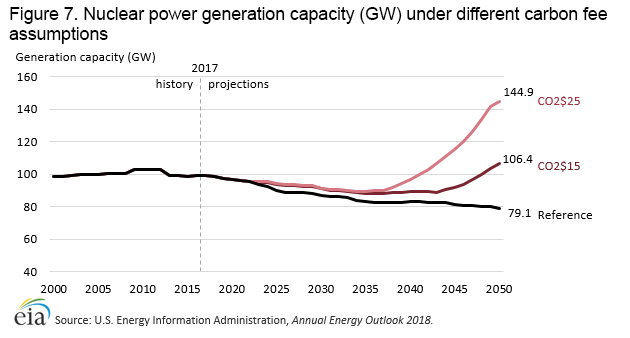
Projections for U.S. nuclear power capacity through 2050 differ measurably across the AEO2018 cases (Table 3). The 2050 projected capacity ranges from 18.1 GW in the HRT case (with 20% higher nuclear power costs) to 144.9 GW in the $25/ton CO2 case, and the Reference case is near the midpoint of the two extremes at 79.1 GW. The results of the sensitivity cases indicate that ranges selected for both the competing natural gas fuel price and nuclear power unit costs have a measurable effect on the rate of nuclear power plant retirements and new builds.
| 2050 Nuclear Generation Capacity (GW) | Change in 2050 Nuclear Generation Capacity (GW) |
||||
|---|---|---|---|---|---|
| Case | 20% higher costs | Reference case costs | 20% lower costs | 20% higher costs | 20% lower costs |
| Reference | 66.0 | 79.1 | 83.8 | -13.1 | 4.7 |
| HRT | 18.1 | 55.3 | 78.9 | -37.2 | 23.6 |
| LRT | 78.8 | 83.0 | 133.7 | -4.2 | 50.7 |
| CO2 starting at $15/ton | 106.4 | 27.3 | |||
| CO2 starting at $25/ton | 144.9 | 65.7 | |||
| Note: Nuclear generation capacity in 2017 was 99.3 GW. | |||||
Reference case
The Reference case projection assumes trend improvements in known technologies along with EIA’s current view of economic and demographic trends. The Reference case also assumes that current laws and regulations affecting the energy sector, including sunset dates for laws that have them, are generally unchanged throughout the projection period. The potential impacts of recently-enacted or proposed legislation, regulations, and standards are not included. Projections in the AEO should be interpreted with a clear understanding of the assumptions that inform them and the limitations inherent in any modeling effort.
In the AEO2018 Reference case, nuclear power generation capacity is projected to decline from 99.3 GW in 2017 to 79.1 GW in 2050. New builds through the projection period are limited to the construction of Vogtle Units 3 and 4, which are already under construction and will provide 2.2 GW of additional capacity. EIA also projects that, through 2040, capacity uprates across the fleet will be approximately 3.8 GW. These incremental additions are outweighed by the announced retirements, anticipated retirements, and plants modeled as uneconomic, which totals approximately 26.2 GW (Figure 2). No new builds, except for the Vogtle units currently under construction, are projected in the Reference case, where natural gas prices rise 65% through 2050 and nuclear power operating costs increase slightly.
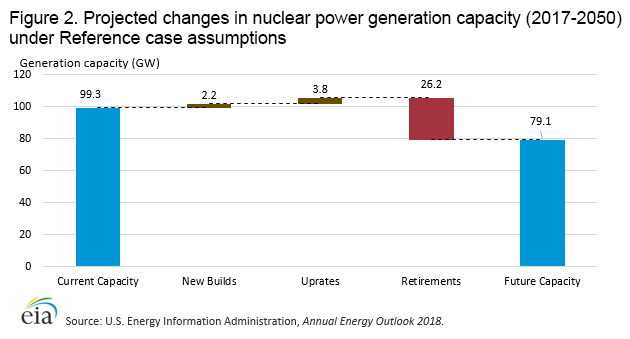
figure data
High and low oil and natural gas resource and technology case results
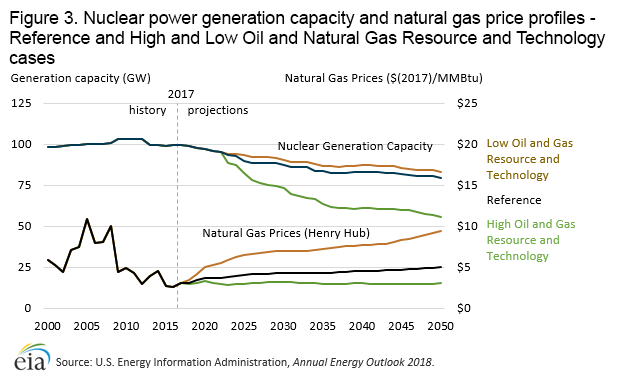
Both the HRT and LRT cases demonstrate how varying natural gas prices (compared with the Reference case) may affect the level of future nuclear power generation. The increased use of low-priced natural gas for baseload electricity generation has resulted in lower wholesale electricity prices in several merchant markets where nuclear plants compete.[30] Lower natural gas prices in the HRT case result in lower electricity prices, and approximately 23.8 GW of additional nuclear power becomes unprofitable. By comparison, higher natural gas prices in the latter years in both the Reference and LRT cases provide sufficient revenues to prevent most units from retiring.
Higher natural gas prices for the electric power sector in the LRT case ($9.42/million British thermal units (MMBtu) by 2050, compared with $5.01/MMBtu in the Reference case ($2017)) reduce early retirements by 3.9 GW though 2050 to 22.3 GW compared with 26.2 GW in the Reference case. Lower natural gas prices in the HRT case ($3.02/MMBtu by 2050) increase early retirements by 23.8 GW to 50.0 GW in the Reference case. Without nuclear power unit cost reductions, all three cases show continued nuclear power retirements through 2050 (Figure 3). The three cases include 6.0 GW of new capacity from new builds (2.2 GW) and power uprates (3.8 GW) in the projection period (2018–2050).[31]
Operating costs
To understand unit cost impacts, EIA varied operating costs under three significantly different scenarios, the Reference, HRT, and LRT cases. For each of these scenarios, unit operating costs were raised or lowered by 20% when compared to operating costs in the Reference case. The 20% change in costs applies to both the operating and maintenance costs for existing units, as well as the capital, operating, and maintenance cost assumptions for any modelled, unplanned nuclear capacity.
These cases illustrate the challenges and opportunities facing the nuclear power sector. In the Reference case, lowering plant operating costs by 20% decreases retirements by nearly 5 GW or 18% (Figure 4). However, raising plant operating costs by 20% from those used in the Reference case, increases retirements by nearly 50% to 39.3 GW, with total nuclear capacity decreasing to 66.0 GW by 2050 in the Reference case.
The changes in nuclear power plant costs have a larger impact on early retirements in the HRT case, where natural gas prices remain historically low. In this case, a 20% higher nuclear plant capital and operating costs results in 37.2 GW of additional retirements through 2050 (Figure 5). In contrast, lowering nuclear plant operating costs 20% in the same case reduces the number of early retirements with lower natural gas prices. The 2050 nuclear generation capacity is 78.9 GW in the HRT with 20% cost reduction case compared with 79.1 GW in the Reference case.
Conversely, higher natural gas prices in the LRT case results in 3.9 GW of additional retirements by 2050. However, when nuclear plant operating costs in the LRT case are reduced by 20%, a net of 44.5 GW of capacity is added between 2035 and 2050 (Figure 6).
Carbon Fee
Two Carbon Fee cases were also simulated to quantify the effect of carbon fees on nuclear power generation. Competing fossil fuels such as coal and natural gas would be subject to the carbon fee, while nuclear power would not. These fees increase the fuel price profiles for natural gas and coal and can result in higher average wholesale electricity prices in markets that use coal or natural gas. As a result, the nuclear plants in those markets would become increasingly competitive. In the cases examined, the carbon fee was modeled to begin in 2020 at either $15 or $25/ton CO2 ($2017), increasing by 5% each subsequent year in real dollar terms.
Under a $25/ton CO2 fee scenario, 59.1 GW of new nuclear power capacity is added through 2050. If the starting fee is lowered to $15/ton, 24.3 GW of new nuclear power capacity is added (Figure 7). In the lower and higher Carbon Fee cases, early retirements are reduced by 3 GW and 7 GW, respectively, by 2050. Also, compared to the lower carbon fee case, the higher carbon fee case results in 34.8 GW of additional new nuclear builds by 2050.
Generation mix
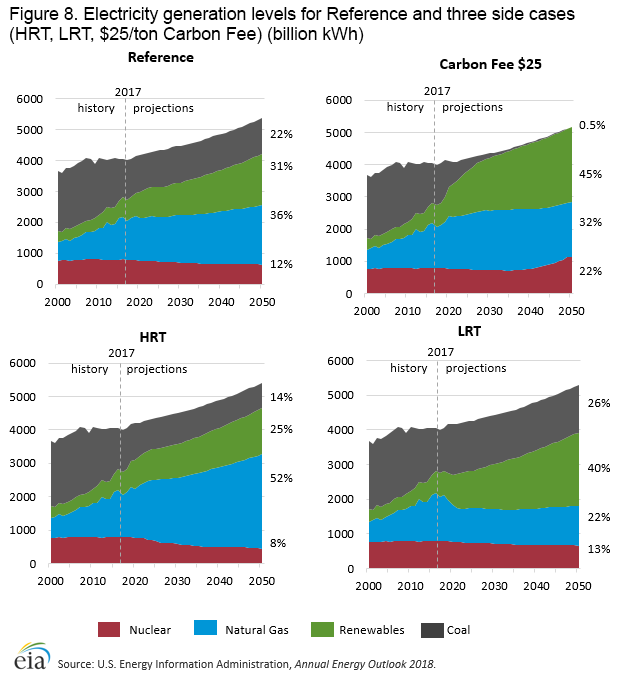
Although nuclear capacity and generation are affected, the changes in natural gas prices or CO2 fees in the sensitivity cases result in more pronounced changes to the other fuels and technologies used to generate electricity. Even though the LRT and Carbon Fee cases result in more nuclear generation when compared with the Reference and HRT cases, the generation mix differs across all of the sensitivity cases. These trends are reflected in the electricity generation mix under the scenarios shown in Figure 8 and in the changes in generation by fuel relative to the Reference case reported in Table 4.
Lower-priced natural gas in the HRT case increases coal and nuclear plant retirements and slows the deployment of renewables as natural gas generation widens its share of total electricity generation from 36% in the Reference case to 52% by 2050. Higher-priced natural gas in the LRT case expands the share of renewables in total generation in 2050 from 31% in the Reference case to 40% and reduces the level of coal and nuclear plant retirements.
CO2 fees increase the cost of generation from coal and natural gas, thereby increasing the relative competitive position of electricity generation from nuclear and renewables. In the $25/ton Carbon Fee case, the current trend of decreasing coal generation accelerates, declining to less than 1% of total generation by 2050 compared with 22% in the Reference case. Renewables increase the most in the higher carbon fee case as the current growth in renewables accelerates through 2027 then continues to grow steadily through 2050, reaching 45% of generation. Natural gas-fired generation is lower compared with the Reference case in 2050 (32% vs 36%) in the high carbon fee case. Starting in 2035, nuclear power also benefits as generation capacity grows significantly from 89 GW in 2035 to 145 GW by 2050, representing 22% of total generation and 80% more nuclear-powered generation compared with the Reference case.
| Fuel Type | High Oil & Gas Resource & Technology (HRT) | Low Oil & Gas Resource & Technology (LRT) | Carbon Fee ($25/ton & 5% Y/Y) |
|---|---|---|---|
| Nuclear | -30% | 4% | 80% |
| Coal | -34% | 18% | -98% |
| Natural Gas | 48% | -40% | -12% |
| Renewables | -17% | 28% | 41% |
The generation composition in the HRT case differs from the Reference case with 48% more natural gas, 34% less coal, 17% less renewables, and 30% less nuclear power by 2050. In the LRT case, nuclear power generation is 4% higher than the Reference case and natural gas generation is 40% lower. Most of the reduced natural gas-fired generation in the LRT case is compensated by 28% more renewable generation and 18% more coal-fired generation. These generation trends indicate that a similar percentage of nuclear plants are unprofitable even when electricity prices are higher compared with the Reference case.
Endnotes
-
NEI - Nuclear Plants in Regulated and Deregulated States, https://www.nei.org/resources/statistics/nuclear-plants-in-regulated-and-deregulated-states
-
Three Mile Island is the latest nuclear power plant to announce retirement plans, https://www.eia.gov/todayinenergy/detail.php?id=31612
-
Many natural gas-fired power plants under construction are near major shale plays, https://www.eia.gov/todayinenergy/detail.php?id=26312
-
Wholesale Electricity and Natural Gas Market Data, https://www.eia.gov/electricity/wholesale/
Fort Calhoun becomes fifth U.S. nuclear plant to retire in past five years, https://www.eia.gov/todayinenergy/detail.php?id=28572
-
Forbes - Illinois Sees The Light -- Retains Nuclear Power, https://www.forbes.com/sites/jamesconca/2016/12/04/illinois-sees-the-light-retains-nuclear-power/#1bfae9f23e7b
-
Reactors Are Closing, http://www.beyondnuclear.org/reactors-are-closing/
-
Nu Will Not Restart Millstone 1, http://articles.courant.com/1998-07-18/business/9807180151_1_nu-restart-electricity
-
Indian Point: State denies certificate for future Hudson River use, https://www.lohud.com/story/news/local/indian-point/2015/11/12/indian-point-state-deniescertificate-hudson-river-use/75652684/
-
Indian Point, closest nuclear plant to New York City, set to retire by 2021, https://www.eia.gov/todayinenergy/detail.php?id=29772
-
CPUC approves Diablo Canyon retirement, 15 EV pilots, storage RFO to replace gas, https://www.utilitydive.com/news/cpuc-approves-diablo-canyon-retirement-15-ev-pilots-storage-rfo-to-replac/514636/
-
California Energy Commission, California's Renewables Portfolio Standard (RPS), http://www.energy.ca.gov/portfolio/
-
Public Act 099-0906, http://www.ilga.gov/legislation/publicacts/99/PDF/099-0906.pdf
-
Governor Cuomo Announces Establishment of Clean Energy Standard that Mandates 50 Percent Renewables by 2030, http://www.governor.ny.gov/news/governor-cuomo-announces-establishment-clean-energy-standard-mandates-50-percent-renewables
-
Clinton nuclear reactor running a year after closing threat, https://chicago.suntimes.com/news/clinton-nuclear-reactor-running-a-year-after-closing-threat/
-
Reprieved New York plant drives local investment, http://www.world-nuclear-news.org/C-Reprieved-New-York-plant-drives-local-investment-0602187.html
-
Combined License Holders for New Reactors, https://www.nrc.gov/reactors/new-reactors/col-holder.html
-
NEI - Delivering the Nuclear Promise, https://www.nei.org/resources/delivering-the-nuclear-promise
-
US nuclear power fleet aims to cut costs by 30%: industry official, https://www.platts.com/latest-news/electric-power/washington/us-nuclear-power-fleet-aims-to-cut-costs-by-30-21584728
-
EIA, Nuclear Reactor, State, and Net Capacity, https://www.eia.gov/nuclear/reactors/reactorcapacity.php
-
Benchmarking Nuclear Plant Operating Costs, http://www.powermag.com/benchmarking-nuclear-plant-operating-costs/?pagenum=3
-
National Conference of State Legislatures - State Options to Keep Nuclear in the Energy Mix, http://www.ncsl.org/Portals/1/Documents/energy/StateOptions_NuclearPower_f05_WEB.pdf
-
WNN - Palisades to operate to 2022, http://www.world-nuclear-news.org/C-Palisades-to-operate-to-2022-2909177.html
-
Execlon - Exelon To Retire Three Mile Island Generating Station in 2019, http://www.exeloncorp.com/newsroom/exelon-to-retire-three-mile-island-generating-station-in-2019
-
Reprieved New York plant drives local investment, http://www.world-nuclear-news.org/C-Reprieved-New-York-plant-drives-local-investment-0602187.html
-
The Blade - Davis-Besse nuclear plant back online — but for how long?, http://www.toledoblade.com/local/2018/03/27/Davis-Besse-nuclear-plant-back-online-but-for-how-long.html
-
Future Energy Jobs Bill Already Delivering Job Growth, Economic Impact, http://www.exeloncorp.com/newsroom/fejb-econ-impact-rls
-
PSEG CEO: Salem, Hope Creek nukes will close absent subsidies, https://www.utilitydive.com/news/pseg-ceo-salem-hope-creek-nukes-will-close-absent-subsidies/512345/
-
Ohio lawmakers weigh bailout for FirstEnergy nuclear plants, http://www.news-herald.com/article/HR/20170409/NEWS/170409451
-
Wholesale power prices in 2016 fell, reflecting lower natural gas prices, https://www.eia.gov/todayinenergy/detail.php?id=29512
-
EIA Annual Energy Outlook 2018, data browser, https://www.eia.gov/outlooks/aeo/data/browser/