
Tight oil expected to make up most of U.S. oil production increase through 2040
Republished February 22, 2017, 5:30 p.m. to correct an error in the listed Permian Basin plays.
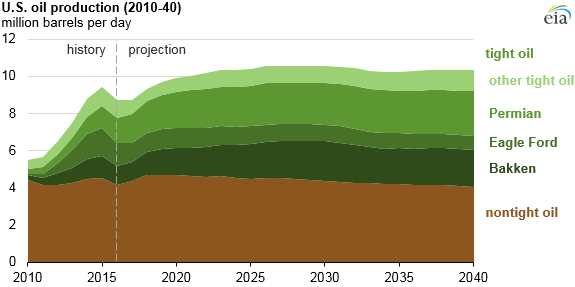
EIA’s recently released Annual Energy Outlook 2017 (AEO2017) Reference case projects that U.S. tight oil production will increase to more than 6 million barrels per day (b/d) in the coming decade, making up most of total U.S. oil production. After 2026, tight oil production remains relatively constant through 2040 in the Reference case as tight oil development moves into less productive areas and as well productivity decreases. Side cases with different resource and technology assumptions result in different tight oil and total U.S. oil production projections.
U.S. production of tight oil has increased significantly since 2010, driven by technological improvements that have reduced drilling costs and improved drilling efficiency in major shale plays such as the Bakken, Eagle Ford, and the Permian Basin. Production from tight oil plays surpassed 50% of total U.S. oil production in 2015 when tight oil production reached 4.9 million per day (b/d). Tight oil production and overall U.S. oil production are expected to increase through around 2030 in the Reference case.
In the Reference case, tight oil production from the Eagle Ford and Bakken—two of the largest tight oil regions in the country—begins to decline after 2020 and 2030, respectively. Production in the Permian Basin (which includes the Spraberry, Avalon/Bone Spring, and Wolfcamp plays) remains relatively high through 2040. Compared with the Eagle Ford and Bakken, the Permian Basin has more geographic extent and contains multiple stacked plays, providing drillers with more opportunities for continued long-term development.
Two side cases included in the AEO2017 analysis apply alternative assumptions regarding technological advances and resource availability, which lead to very different projections for tight oil production. In the High Oil and Gas Resource and Technology case, which uses more optimistic technology and resource assumptions, tight oil reaches 11.0 million b/d by 2035, or 66% of total U.S. production, as higher well productivity reduces development and production costs, spurring additional resource development. In the Low Oil and Gas Resource and Technology case, which applies more pessimistic technology and resource assumptions than in the Reference case, tight oil provides less than half of total oil production after 2030, and total U.S. oil production in 2040 is well below its current level.
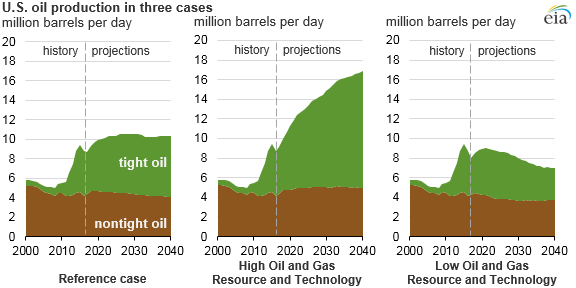
Projected oil production in the United States is also sensitive to the path of world oil prices, as shown in two other cases. In the AEO2017 High Oil Price case, where world oil prices rise rapidly and are sustained at higher levels, oil production increases to 13.0 million b/d by 2021 before declining to 10.5 million b/d by 2040. Despite reaching a higher production level faster, total cumulative production through 2040 is lower in the High Oil Price case compared with the slow but steady production increase High Oil and Gas Resource and Technology case. In the AEO2017 Low Oil Price case, sustained low prices lead oil production to fall below 8 million b/d by 2022 and to gradually decline to 7 million b/d by 2040.
Principal contributors: Faouzi Aloulou, Troy Cook