Coal production declines in 2016, with average coal prices below their 2015 level
Note: Production data for 2016 include estimated October through December 2016 production.
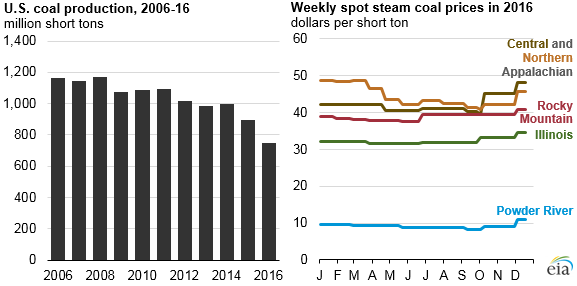
U.S. coal production in 2016 is expected to total 743 million short tons (MMst), 17% lower than in 2015, and the lowest level since 1978. Falling production in 2016 continues an eight-year decline from peak production in 2008. Production in all major coal regions fell by at least 15%. Low natural gas prices, warmer-than-normal temperatures during the 2015-16 winter that reduced electricity demand, the retirements of some coal-fired generators, and lower international coal demand have contributed to declining U.S. coal production.
Note: Data for October 2016 through December 2016 are EIA estimates.
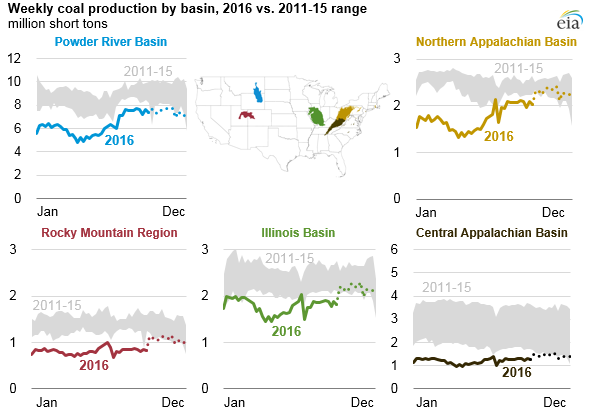
The United States has five major basins or regions that produce coal. Although weekly coal production in most basins increased slightly since mid-year, weekly production levels in all areas throughout 2016 have been significantly lower than over the previous five years. The largest annual decline in coal production in 2016 was in the Powder River Basin, which declined by 70 MMst (17%) from 2015 levels. Declines in coal production relative to 2015 levels ranged from 16% to 26% in the Northern and Central Appalachian basins, the Rocky Mountain region, and the Illinois Basin.
Nearly all coal use in the United States is for electricity generation. In the past few years, coal's share of electricity generation has fallen as it has faced increasing competition from natural gas and renewables. The average daily natural gas spot price at the Henry Hub, a key benchmark, fell from $2.63 per million British thermal units (MMBtu) in 2015 to $2.40/MMBtu in 2016, resulting in increased natural gas-fired electricity generation. In 2016, natural gas-fired electricity generation surpassed coal-fired generation for the first time, accounting for an estimated 34% of total electricity generation compared with coal’s 30% share. The most recent Short-Term Energy Outlook forecasts total 2016 power sector coal consumption at about 681 MMst, the lowest level since 1985.
U.S. coal exports declined in 2016. Approximately 26 MMst of coal is estimated to have been exported to Europe in 2016, down from 38 MMst in 2015. U.S. coal exports to Asia also declined in 2016, particularly to South Korea, where exports are estimated to have been about 3.5 MMst, a 43% decrease from the 2015 level. EIA estimates that the United States exported 57 MMst of coal in 2016, a 23% decline from the previous year.
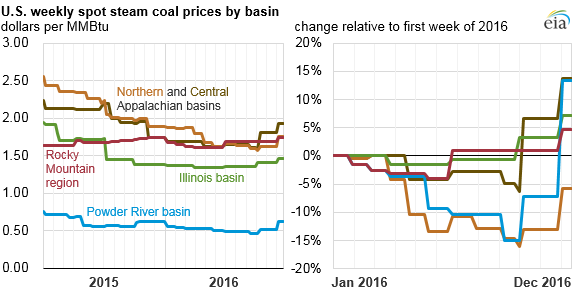
On a year-to-date basis,average delivered cost of coal for power plants over the January through September period decreased from $2.27 per million Btu in 2015 to $2.17 per million Btu in 2016. However, trends in steam coal prices during the first six months of the year were very different from those in the latter six months. High coal stockpile levels driven by increased use of natural gas and a warmer-than-normal winter reduced electricity demand, which resulted in a continued decrease in steam coal prices through the first half of the year, with the largest percentage declines in the prices of Central Appalachian Basin and Powder River Basin coal.
However, from July to December, lower coal supplies, warm temperatures that raised summer electricity demand, and increasing natural gas prices led to higher steam coal prices in all five producing areas. Powder River Basin and Central Appalachian Basin coal prices rose by approximately 20%, and prices of North Appalachian Basin, Rocky Mountain, and Illinois Basin coal increased by close to 10%. As a result, coal prices in all basins, with the exception of the Northern Appalachian basin, were higher at the end of 2016 than at the beginning of the year.
Principal contributor: Brian Park
Tags: coal, prices, production/supply