Solar, natural gas, wind make up most 2016 generation additions
Republished March 2, 2016, 9:00 a.m. to correct an error in the text.
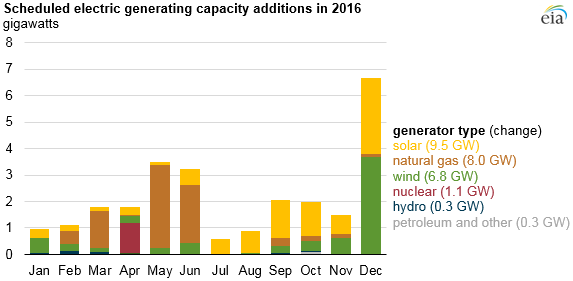
Electric generating facilities expect to add more than 26 gigawatts (GW) of utility-scale generating capacity to the power grid during 2016. Most of these additions come from three resources: solar (9.5 GW), natural gas (8.0 GW), and wind (6.8 GW), which together make up 93% of total additions. If actual additions ultimately reflect these plans, 2016 will be the first year in which utility-scale solar additions exceed additions from any other single energy source.
These values reflect reported additions and retirements, not model projections. This year, as is the case in many years, expected capacity additions in December are much higher than in any other month. This typically happens because of the expiration of federal, state, or local tax credits on December 31, or because of how respondents complete the survey. Many projects expected to begin operation sometime in 2016 are conservatively estimated for a December completion date.
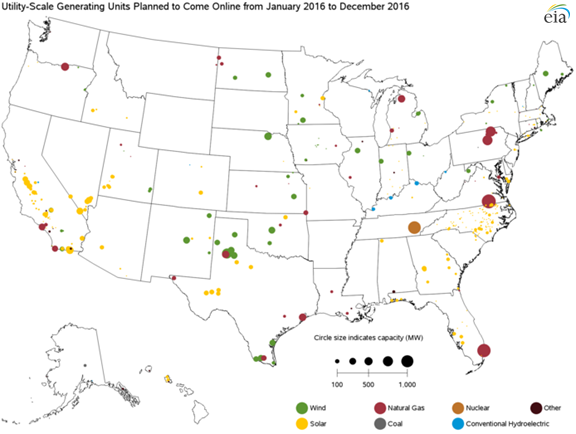
Solar. Planned utility-scale solar additions total 9.5 GW in 2016, the most of any single energy source. This level of additions is substantially higher than the 3.1 GW of solar added in 2015 and would be more than the total solar installations for the past three years combined (9.4 GW during 2013-15). The top five states where solar capacity is being added are California (3.9 GW), North Carolina (1.1 GW), Nevada (0.9 GW), Texas (0.7 GW), and Georgia (0.7 GW). These values reflect utility-scale solar capacity additions, and do not include any distributed generation (i.e., rooftop solar). In 2015, nearly 2 GW of distributed solar photovoltaic capacity was added. The same federal tax credit incentives for distributed solar installations available in 2015 are available in 2016.
Natural gas. Most capacity additions over the past 20 years have been natural gas-fired units. About 8 GW is expected to be added this year, slightly above the 7.8 GW average annual additions over the previous five years. Four states plan to add more than 1 GW of natural gas-fired capacity this year: Pennsylvania (1.6 GW), Virginia (1.4 GW), Florida (1.3 GW), and Texas (1.1 GW).
Wind. Additions of wind capacity are expected to be slightly lower than in 2015, when 8.1 GW of wind made up by far the largest portion of 2015 capacity additions. Wind capacity additions in 2016 are expected to total 6.8 GW. Most wind additions are found in the Plains region between the Dakotas and Minnesota, south to Texas and eastern New Mexico.
Nuclear. Tennessee Valley Authority's Watts Bar 2 nuclear facility in southeastern Tennessee, with a summer nameplate capacity of 1.1 GW, is expected to begin commercial operation in June 2016. When Watts Bar 2 comes online, it will be the first new nuclear reactor brought online in the United States in 20 years. The most recent reactor to come online was Watts Bar 1 in May 1996.
More information about planned capacity additions is available in EIA's Electric Power Monthly.
Principal contributors: Tim Shear, Sara Hoff
Tags: capacity, electricity, generating capacity, generation, hydroelectric, map, natural gas, nuclear, renewables, solar, wind