-
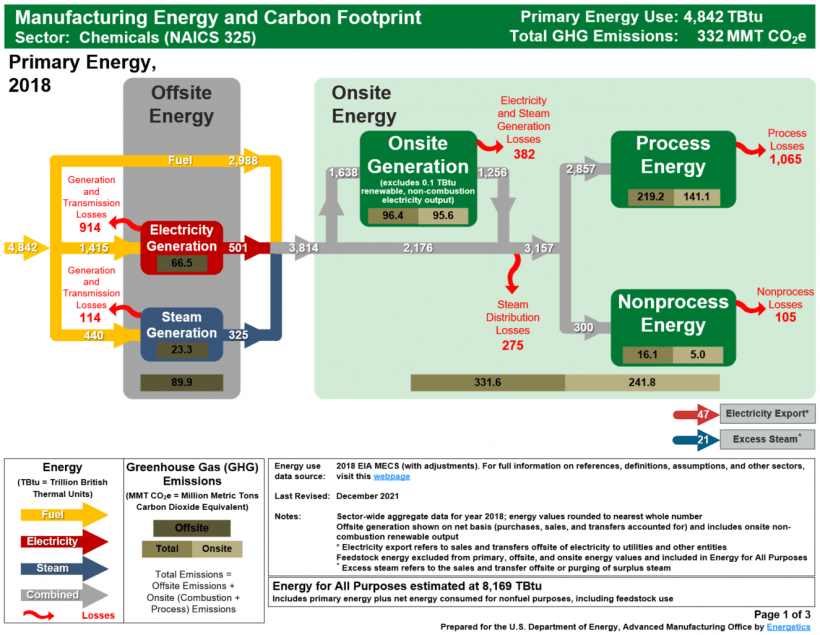
The chemicals subsector accounted for the largest share of purchased electricity, natural gas, and steam

-
On average, primary metals, paper, and transportation equipment establishments were the largest

-
More than 40% of manufacturing establishments participated in general energy management activities

-
Improving energy efficiency is important for the top energy-consuming subsectors

-
Natural gas and HGLs continue to increase their shares of total consumption

-
Growth in gross output continues to outpace manufacturing energy consumption growth

-
Nonfuel consumption is dominant in the chemicals sector

-
Four sectors account for most manufacturing energy consumption

-
Natural gas was the most-used fuel for all end uses

Final results from the 2022 Manufacturing Energy Consumption Survey (MECS) are now available
Release date: March 18, 2026
The final set of results from the 2022 Manufacturing Energy Consumption Survey (MECS), which includes 12 new data tables and accompanying highlights, provides information on ratios of manufacturing fuel consumption to economic characteristics, average prices and quantities of purchased energy sources, and floorspace and building counts.
The new data show:
- Consumption ratios of fuel by region were highest in the South.
- On average, electricity and distillate fuel oil were the most expensive energy sources.
- The average price of energy varied by region.
- The chemicals subsector accounted for the largest share of purchased electricity, natural gas, and steam.
- Petroleum and coal products had the highest energy consumption per employee.
- Fabricated metal products establishments were the most numerous of all industries.
- On average, primary metals, paper, and transportation equipment establishments were the largest.
Further, we republished nine data tables to provide hydrogen estimates by subsector and industry at the national level. This release is the first time we have published hydrogen estimates for the Manufacturing Energy Consumption Survey (MECS). You can find these data in our data tables for:
- Consumption Energy for All Purposes (First Use)
- Energy Used as a Nonfuel (Feedstock)
- Energy Consumption as a Fuel
- Offsite-Produced Fuel Consumption
Data Tables
2022 Manufacturing Energy Consumption Survey: Highlights from Final Data Release PDF
Features
Final results for energy management activities and establishment counts from the 2022 Manufacturing Energy Consumption Survey (MECS) are now available
Release date: December 17, 2025
The third set of results from the 2022 Manufacturing Energy Consumption Survey (MECS), which include 29 new data tables and accompanying highlights, provide information on U.S. manufacturing energy management activities and establishment counts.
The new data show:
- Price changes would not affect the switch to alternative fuels.
- More than 40% of manufacturing establishments participated in general energy management activities.
- Less than 1% of manufacturing establishments had cogeneration technologies.
- The largest shares of onsite cogeneration and onsite generation from other sources were in the South.
- Improving energy efficiency is important for the top energy-consuming subsectors.
We will continue releasing the final 2022 MECS data through Spring 2026. A detailed schedule of the 2022 MECS release dates is available on the MECS data website.
Data Tables
2022 Manufacturing Energy Consumption Survey: Highlights from Data Release 1–3 PDF
Final results for consumption by economic characteristics of the manufacturers and expenditures for purchased energy sources from the 2022 Manufacturing Energy Consumption Survey (MECS) are now available
Release date: September 24, 2025
The second set of results from the 2022 Manufacturing Energy Consumption Survey (MECS), which include 9 new data tables and accompanying highlights, provide information on U.S. manufacturing energy consumption by economic characteristics of the manufacturers and expenditures for purchased energy sources.
The new data show:
- The top five energy-consuming sectors account for about three-fourths of energy expenditures.
- Establishments with the largest value of shipments and receipts accounted for over half of energy consumption.
- At the national level, total consumption was similar across employment size categories.
- Most natural gas and steam were purchased from nonutilities.
We will continue releasing the final 2022 MECS data through Spring 2026. A detailed schedule of the 2022 MECS release dates is available on the MECS data website.
Data Tables
2022 Manufacturing Energy Consumption Survey: Highlights from Data Release 1 and 2 PDF
Final consumption, end use, and fuel-switching results from the 2022 Manufacturing Energy Consumption Survey (MECS) are now available
Release date: August 6, 2025
First set of results from the 2022 Manufacturing Energy Consumption Survey (MECS), which include 35 new data tables and accompanying highlights, provide information on U.S. manufacturing energy consumption (fuel and nonfuel), end uses of fuel consumption, and fuel-switching capability.
The new data show:
- Manufacturing energy consumption continues to grow, in part, due to increased natural gas consumption
- Nonfuel (feedstock) consumption is greatest in chemical manufacturing
- Four subsectors—chemical, petroleum and coal products, paper, and primary metals—account for most of the manufacturing energy consumption
- Most subsectors cannot easily switch from natural gas to alternative fuels such as coal, electricity, and renewables
We will continue releasing the final 2022 MECS data through Spring 2026. A detailed schedule of the 2022 MECS release dates is available on the MECS data website.
Preliminary estimates show increased total U.S. manufacturing energy consumption in 2022
Release date: March 20, 2025
Preliminary results from our 2022 Manufacturing Energy Consumption Survey (MECS) show that total U.S. manufacturing energy consumption increased 6% between 2018 and 2022. MECS is the only source for national estimates of energy-related characteristics, consumption, and expenditures for manufacturers in the United States.