Economy, weather, and CO2
U.S. macroeconomics
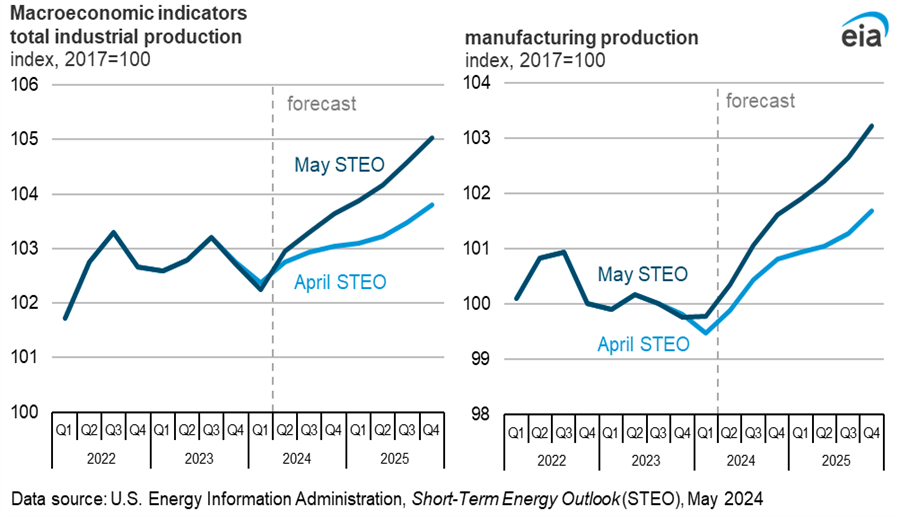
Our forecast for May 2024 assumes real GDP will grow by 2.5% in 2024, unchanged from the forecast in April. The forecast for GDP growth was revised lower in 1Q24 but higher in 2H24 and beyond, resulting in the unchanged overall growth rate for 2024. We revised our assumption of f annual GDP growth in 2025 higher by 0.3 percentage points to 1.9%.
Our macroeconomic forecasts are based on S&P Global’s macroeconomic model. We incorporate energy price forecasts from STEO into the model to obtain the final macroeconomic assumptions.
This month’s forecast includes an upward revision to industrial and manufacturing production from last month’s STEO. The revision follows the release of the U.S. Bureau of Economic Analysis’s third estimate of 4Q23 GDP. The report showed value added from private-goods-producing industries increased 7.0%, led by both durable and non-durable goods manufacturing as well as construction. An increase in the forecast for industrial production increased our forecast for residual fuel oil consumption in 2025 compared with last month’s STEO. Residual fuel oil is used in a variety of industrial processes. An increase in manufacturing tends to increase demand for transporting goods by trucks and trains, and the forecast for more manufacturing production led us to increase our distillate fuel demand in 2025. We now expect U.S. distillate consumption to rise by 2% next year, up from our forecast of 1% last month.
Emissions
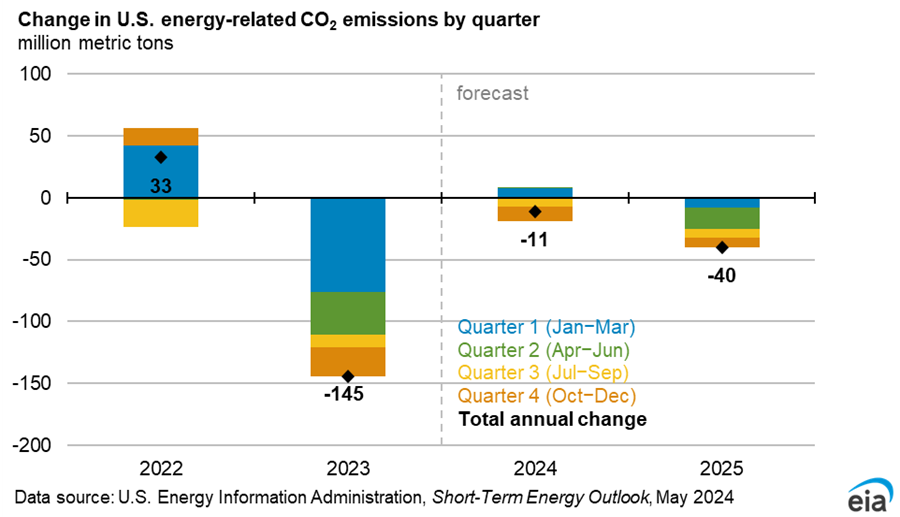
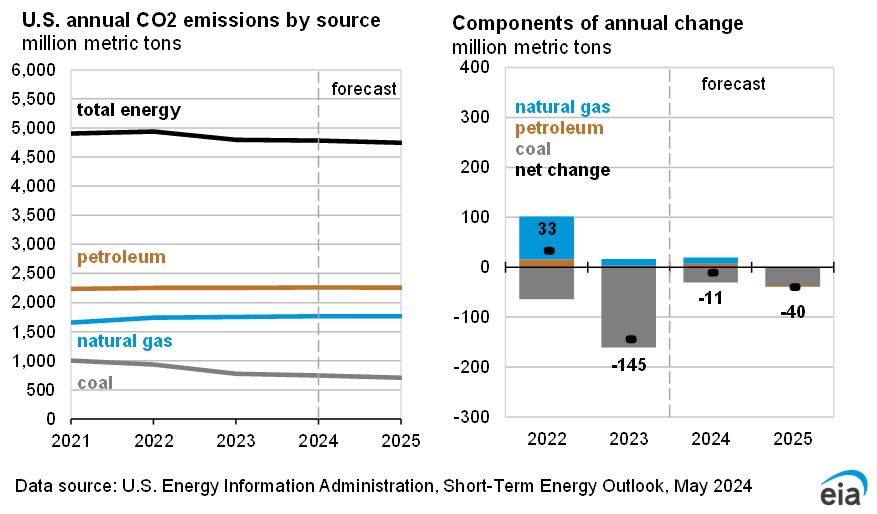
U.S. energy-related carbon dioxide (CO2) emissions decrease year-over-year in almost every quarter during the forecast period, continuing an ongoing downward trend, and leading to 1% fewer annual emissions in 2025 compared with 2023. Coal-related CO2 emissions decline by 4% in 2024 as coal-fired electricity generation continues to fall. Natural gas emission rise by around 1% over the course of the year, mostly from increased natural-gas-fired power generation during 1Q24 and increased residential and commercial sector consumption in 4Q24. Petroleum emissions remain relatively unchanged in 2024.
U.S. CO2 emissions in our forecast decline by 1% from 2024 to 2025. Small reductions in CO2 emissions are mostly a result of continued changes in the electricity generation mix. Continued decreases in coal-fired generation reduce emissions in 2Q24 and 4Q24, and decreasing natural gas-fired generation reduces emissions in 3Q24.
Weather
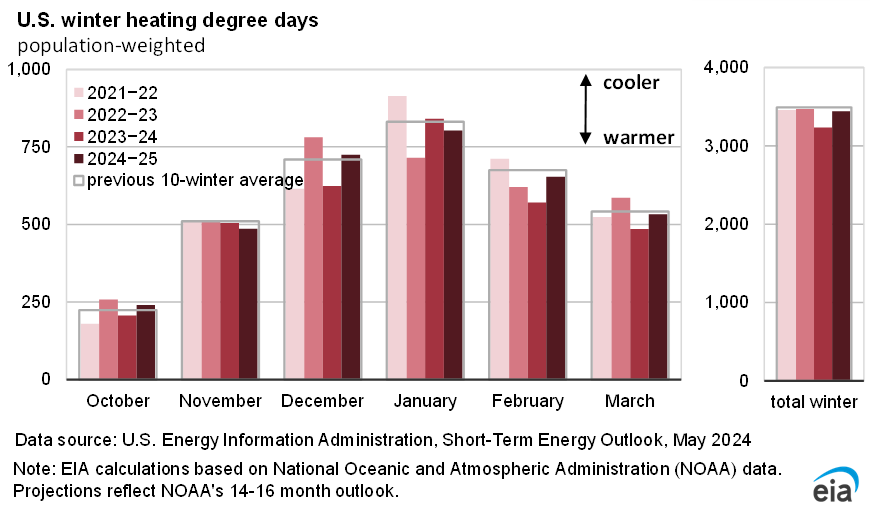
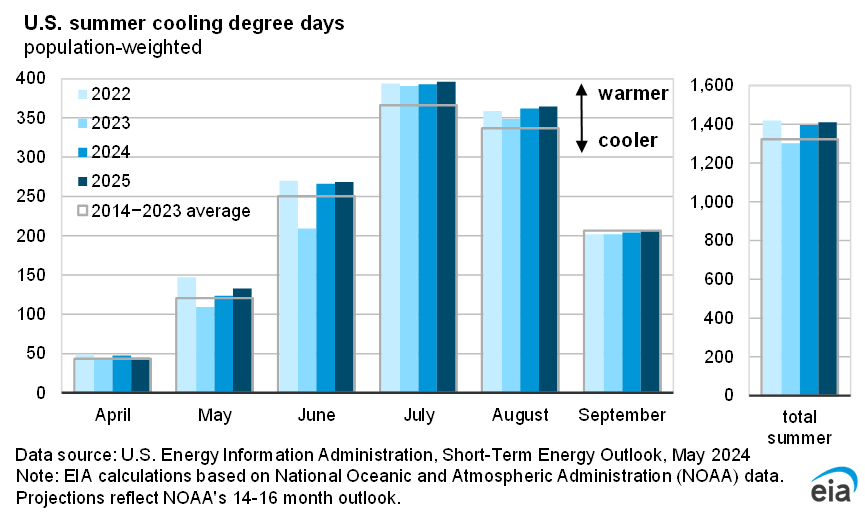
Our forecast assumes the United States will experience a warmer summer (May–September) in 2024 than in 2023, averaging almost 440 cooling degree days (CDDs) in 2Q24, 21% more CDDs than in 2Q23. As a result, we expect 2024 to be hotter than it was last year with around 1,550 CCDs (5% more than in 2023). We expect the summer warming trend to continue into 2025 with about 1% more CDDs during 2Q25 through 3Q25 than during the same period in 2024. However, we expect next winter to be slightly cooler than last winter with the United States averaging 3,440 heating degree days in 4Q24 through 1Q25, 6% more than in the same period last winter.