Petroleum products
Crude oil inventories
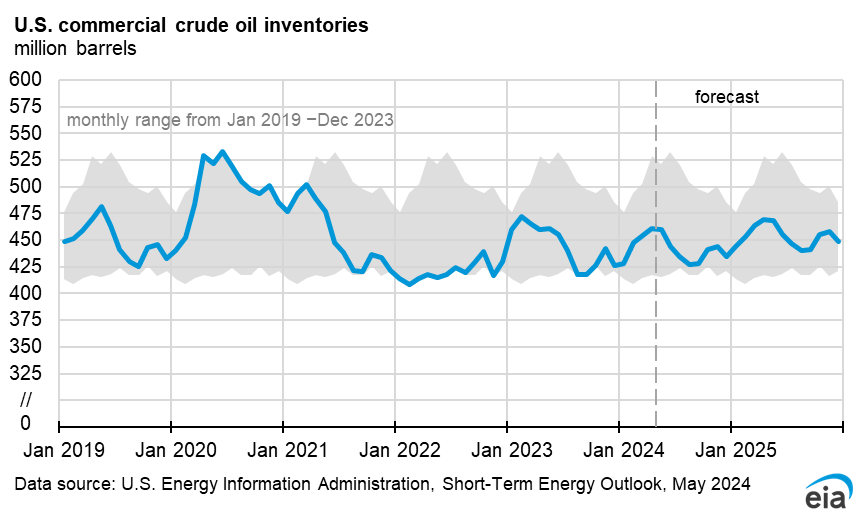
We forecast that U.S. commercial crude oil inventories (inventories that exclude crude oil in the Strategic Petroleum Reserve) will fall near the bottom of the five-year (2019–23) range in July and August 2024 and then increase to near the 2020–24 average during the second half of 2025 (2H25).
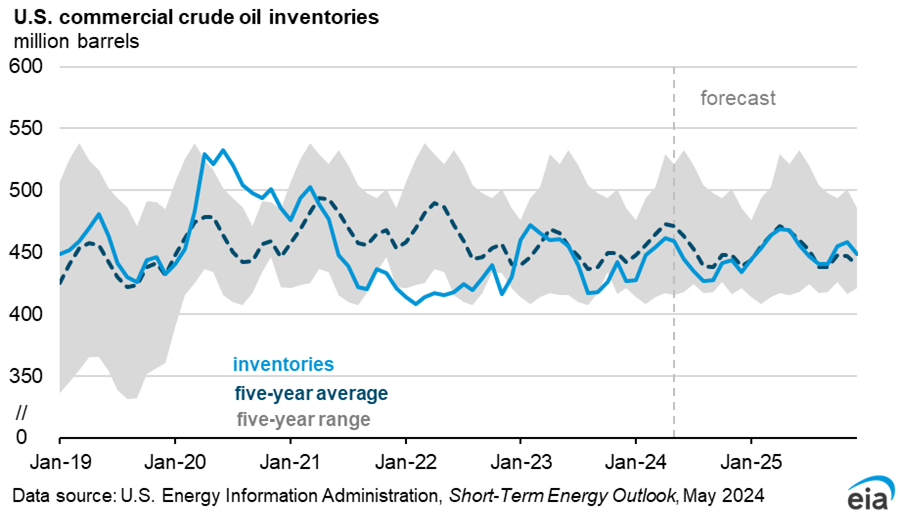
At the end of April, U.S. commercial crude oil inventories were 461 million barrels. We forecast that U.S. commercial crude oil inventories will fall to below 430 million barrels in August, near the previous five-year low for that month. The decline in commercial crude oil inventories reflects our expectation of increasing U.S. refinery runs in the coming months. We forecast that refinery runs will increase from an average of 15.4 million b/d in 1Q24 to an average of 16.2 million b/d in 3Q24 contributing to a draw in inventories between the end of 1Q24 and the end of 3Q24. Our forecast of U.S. crude oil production growth over the same period does not increase inventories because we expect relatively tight global oil markets in the coming months will mean that additional production will either be exported due to strong global demand for U.S. crude oil or displace some existing crude oil imports. Despite the strong increase in runs between 1Q24 and 3Q24, we forecast that overall refinery runs in 2024 will average 15.9 million b/d, down slightly from 16.0 million b/d in 2023.
We forecast that U.S. commercial crude oil inventories will generally increase relative to the five-year average after August 2024, surpassing the average in October 2025. Rising crude oil inventories are driven by increasing U.S. crude oil production and decreasing U.S. refinery runs, along with loosening global oil market balances. We forecast that U.S. crude oil production will increase to an average of 13.7 million b/d in 2025, surpassing the previous record of 12.9 million b/d set in 2023. We forecast that U.S. refinery runs will fall by 1%, averaging 15.8 million b/d in 2025, down from 16.0 million b/d in 2023.
Crude oil net imports
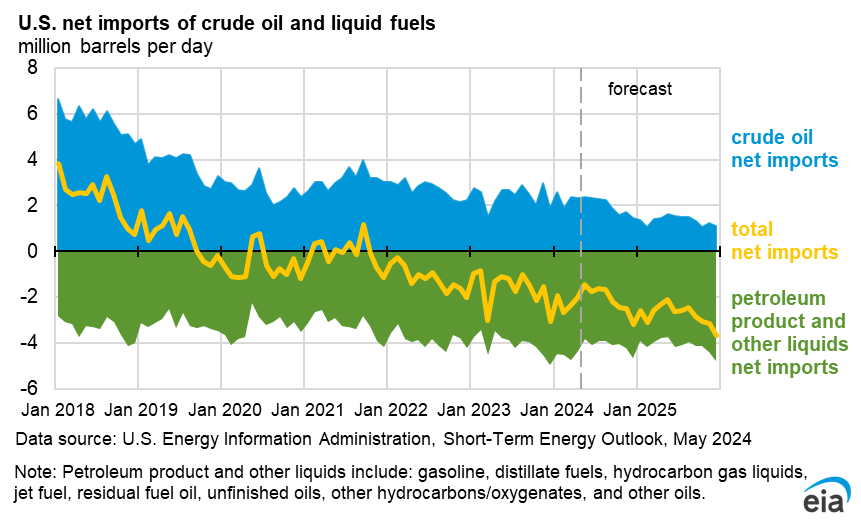
Increasing U.S. crude oil production and decreasing refinery runs will reduce net imports of crude oil (the difference between crude oil imports and crude oil exports) in late 2024 and in 2025. Crude oil net imports have been generally declining for many years, and we expect that trend to continue. The United States has imported less crude annually in most years since 2005, and U.S. crude oil exports have generally increased since December 2015, when the United States lifted restrictions on exporting crude. In the STEO, however, we forecast net crude oil imports and not gross exports and gross imports separately. We forecast that U.S. crude oil net imports will fall from 2.4 million b/d in 2023 to 2.1 million b/d in 2024 and then fall to 1.3 million b/d in 2025.

An area of uncertainty for net crude oil imports is the effect of the TMX pipeline, which began operations on May 1, 2024. Most of Canada’s crude oil exports go to the U.S. Midwest. We expect the startup of TMX will result in more of Canada’s crude oil being exported from Canada’s West Coast. This change could have two effects. First it could decrease imports from Canada to Midwest refiners. Second, crude oil imports from Canada to the U.S. West Coast could increase. However, the ultimate effect on U.S. crude oil trade from the TMX expansion will depend on demand for Canada’s crude oil from refiners globally relative to those in the United States and on the pace of crude oil production increases in Canada.