Forecast overview
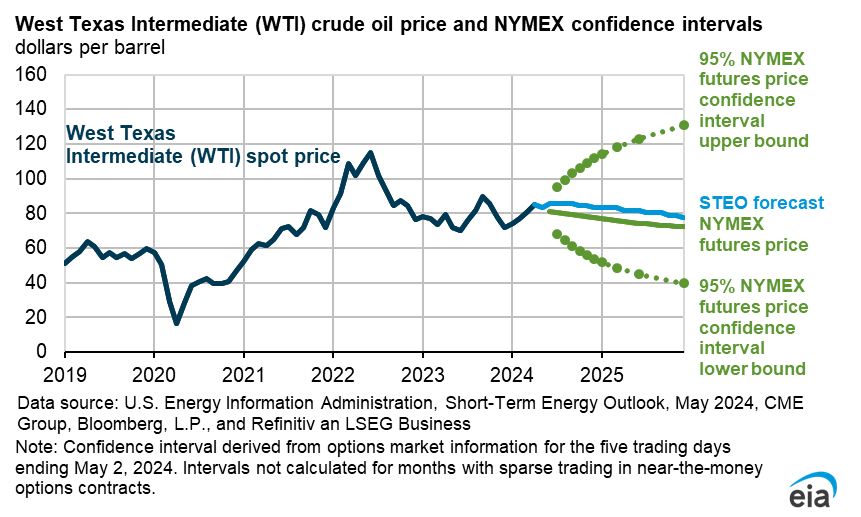
- Global oil prices. We expect voluntary OPEC+ crude oil production cuts and ongoing geopolitical risks will keep the Brent crude oil spot price near $90 per barrel (b) for the remainder of 2024 before falling to an average of $85/b in 2025 as global oil production growth picks up.
- Global oil production tables. This month we are publishing streamlined global oil data tables. These tables provide a more complete breakout of OPEC+ production data and provide a new breakout of world crude oil and other liquid fuels production.
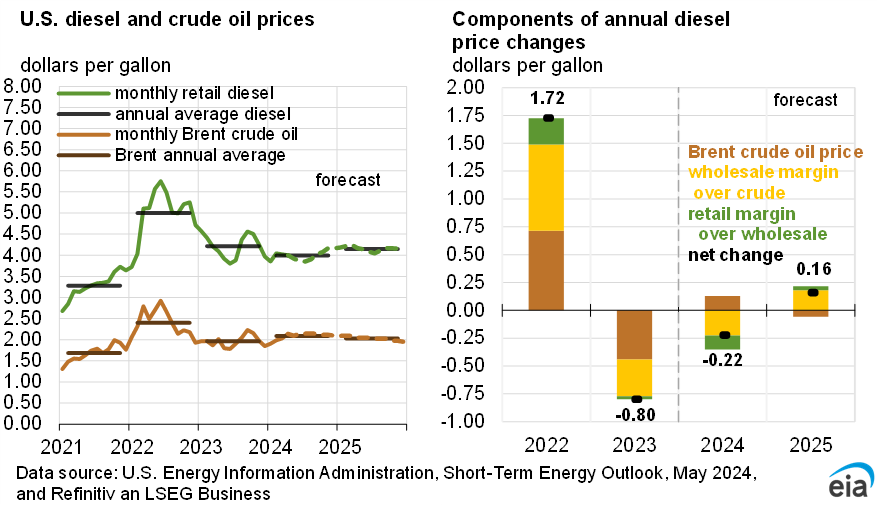
- U.S. retail gasoline prices. Across the United States, we forecast that retail gasoline prices will average near $3.70 per gallon from April through September, which is similar to prices during the same period last year. Refinery operations are a source of uncertainty for gasoline markets this summer. An upcoming Perspectives supplement looks in more depth at the effect refinery operations could have on retail gasoline prices.
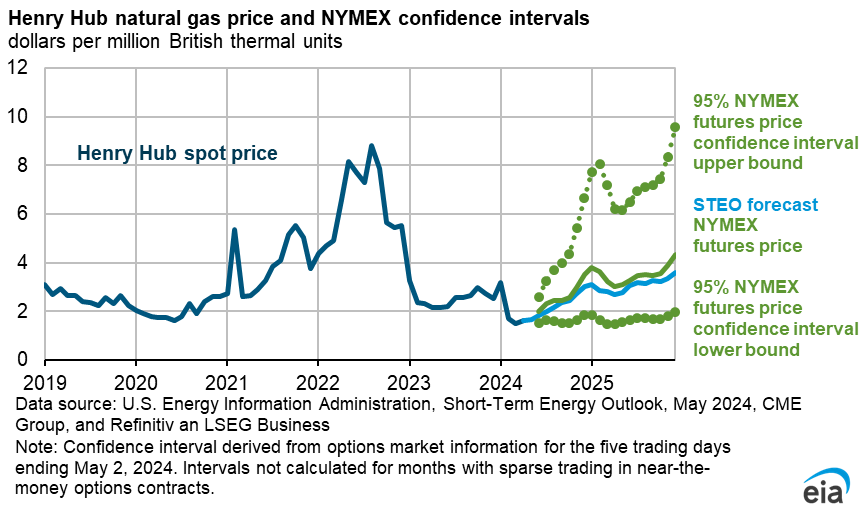
- Natural gas production. We expect U.S. dry natural gas production to fall by 2% from the first quarter of 2024 (1Q24) to 2Q24 as a result of low natural gas prices. We expect 1% less natural gas will be produced in the United States in 2024 than last year before production increases by 2% in 2025 to a record of almost 105 billion cubic feet per day (Bcf/d).
- Natural gas consumption. U.S. natural gas consumption in our forecast is mostly unchanged in 2024 compared with last year, averaging 89 Bcf/d. We expect that less consumption in the industrial sector will offset increases in natural gas consumption in the electric power, residential, and commercial sectors.
- Electricity generation. Solar supplies most of our forecast growth in U.S. electricity generation this year. We expect total U.S. electricity generation will grow by 3% (114 billion kilowatthours) in 2024, and we forecast generation from utility-scale solar will contribute almost 60% of that increase. Among other renewable sources, wind contributes 19% of 2024 U.S. electricity generation growth, and hydropower contributes 13%.
- Coal markets. We have revised our estimate of U.S. coal exports in 2024 upwards by 4% compared with the April Short-Term Energy Outlook (STEO) due to more-than-expected metallurgical coal exports from the Appalachia region in February. We now expect U.S. coal exports in 2024 will be almost unchanged from 2023. However, we still expect coal production will decline by 14% in 2024 to about 500 million short tons and then fall by about 1% next year. But more coal exports in this STEO compared with last month’s forecast mean the decline is less than we had forecast last month; we raised our forecast for U.S. coal production from last month by 3% in 2024 and by 6% in 2025.
| Notable Forecast Changes | 2024 | 2025 |
|---|---|---|
Note: Values in this table are rounded and may not match values in other tables in this report. |
||
| Coal exports (current forecast) (million short tons) | 99 | 106 |
| Previous forecast | 94 | 105 |
| Percentage change | 4.5% | 0.8% |
| Coal production (current forecast) (million short tons) | 499 | 494 |
| Previous forecast | 485 | 464 |
| Percentage change | 2.9% | 6.3% |
| Secondary coal inventories (current forecast) (million short tons) | 142 | 154 |
| Previous forecast | 138 | 128 |
| Percentage change | 2.4% | 20.9% |
You can find more information in the detailed table of forecast changes.