Global oil markets
Global oil prices and inventories
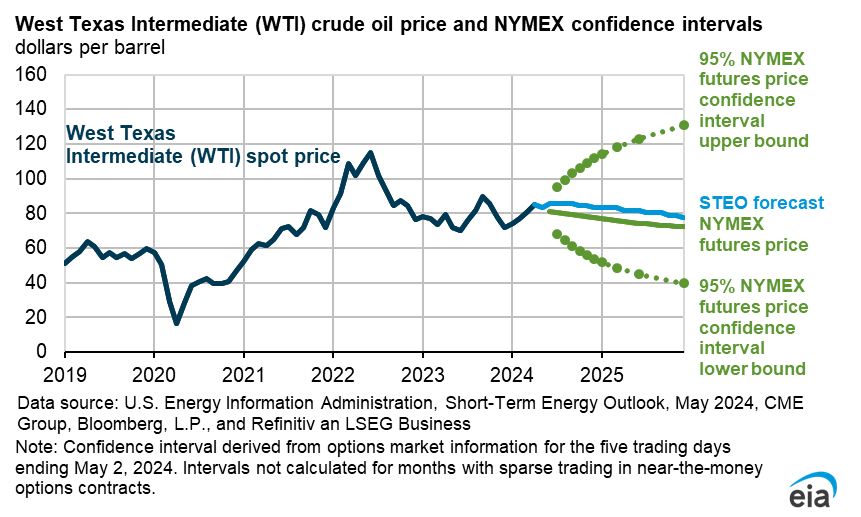
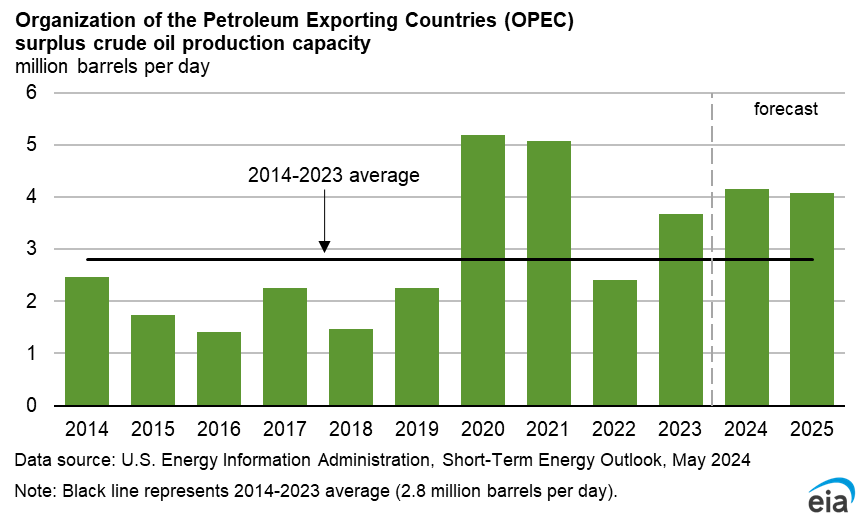
The spot price of Brent crude oil averaged $90 per barrel (b) in April, up $5/b from March and the fourth consecutive monthly increase. However, daily crude oil spot prices have since fallen, and the Brent spot price settled at $84/b on May 2. Prices increased in April due to falling global oil inventories. Geopolitical tensions also supported crude oil prices amid conflict between Iran and Israel, which added uncertainty to already heightened tensions in the Middle East. Despite these tensions, crude oil price volatility has been subdued for much of this year by significant spare crude oil production capacity. If holders of spare production capacity choose to deploy it, supply can be available to the oil market in the event of any short-term supply disruption. We estimate OPEC spare production capacity will be around 4 million barrels per day (b/d) through 2025.

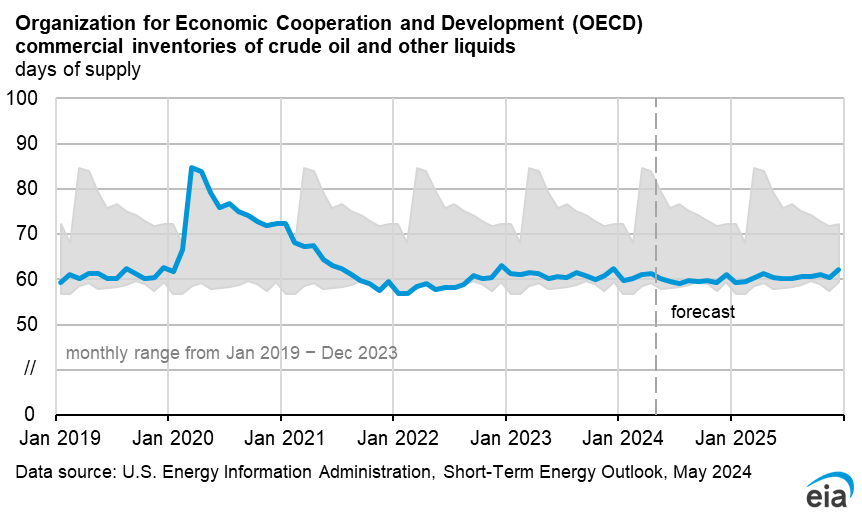
We assess that voluntary OPEC+ production cuts are reducing global oil inventories in the first half of 2024 (1H24). We estimate that global oil inventories are decreasing by an average of 0.3 million b/d in 1H24. We anticipate some OPEC+ producers will continue to limit production after current voluntary OPEC+ cuts expire at the end of June. Our expectation of ongoing production restraint leads to our forecast of a relatively balanced oil market in 2H24, which we expect will keep oil prices near $90/b for the remainder of 2024, before stronger supply growth contributes to global oil inventory builds of 0.4 million b/d in 2025, causing prices to fall to an average of $85/b next year. However, there remains significant uncertainty centered around ongoing developments in the Middle East, which have the potential to increase oil price volatility and lead to sharp increases in oil prices.
Global oil production
Beginning with this month’s STEO, we will include new streamlined global oil data tables. These tables provide a more complete breakout of OPEC+ production data and provide a new breakout of world crude oil production that is separate from other liquid fuels production. We are also including liquid fuels and crude oil production breakouts for OPEC+ members. Given the large role OPEC+ plays in global oil markets, this new layout will allow stakeholders to more easily find relevant OPEC+ production data in our tables while also accurately summarizing the role that the OPEC+ agreement plays in our STEO forecast.

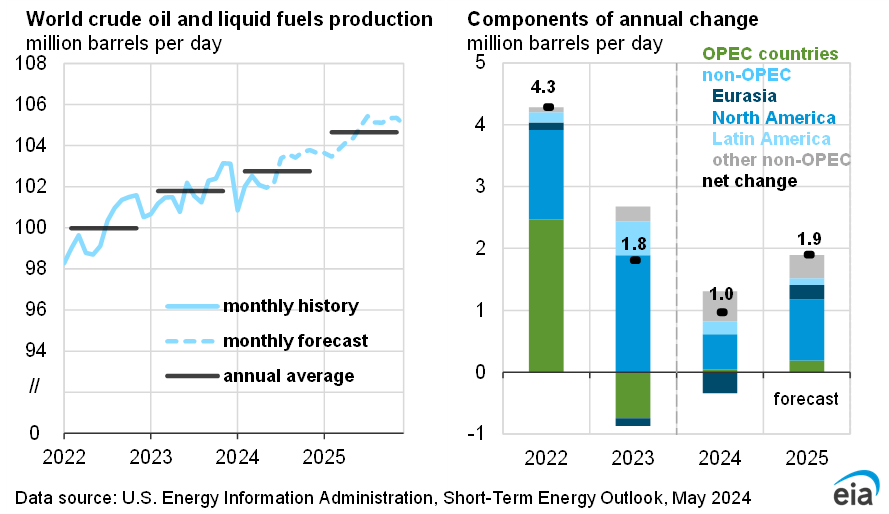
The OPEC+ cuts are restraining world oil production growth this year, partly offsetting growth from outside of OPEC+. We expect that global production of petroleum and other liquid fuels will increase by 1.0 million b/d in 2024, slowing from growth of 1.8 million b/d in 2023. Although OPEC+ liquid fuels production decreases by 0.8 million b/d in 2024, production outside of OPEC+ increases by 1.8 million b/d, led by growth in the United States, Canada, Brazil, and Guyana.
In Canada, we expect the startup of the Trans Mountain pipeline expansion (TMX) on May 1 will alleviate existing distribution bottlenecks and allow for gradual increases in crude oil production. We forecast liquid fuels production will increase in Canada by 0.5 million b/d over the forecast period, which is more than 0.2 million b/d above our forecast in last month’s STEO prior to the announcement of the pipeline’s startup. Global liquid fuels production increases by 1.9 million b/d in 2025 as the OPEC+ production cuts expire and production outside of OPEC+ continues to grow.